Immigrants from Scotland vs Immigrants from Australia 10th Grade
COMPARE
Immigrants from Scotland
Immigrants from Australia
10th Grade
10th Grade Comparison
Immigrants from Scotland
Immigrants from Australia
95.2%
10TH GRADE
99.9/ 100
METRIC RATING
39th/ 347
METRIC RANK
94.9%
10TH GRADE
99.7/ 100
METRIC RATING
66th/ 347
METRIC RANK
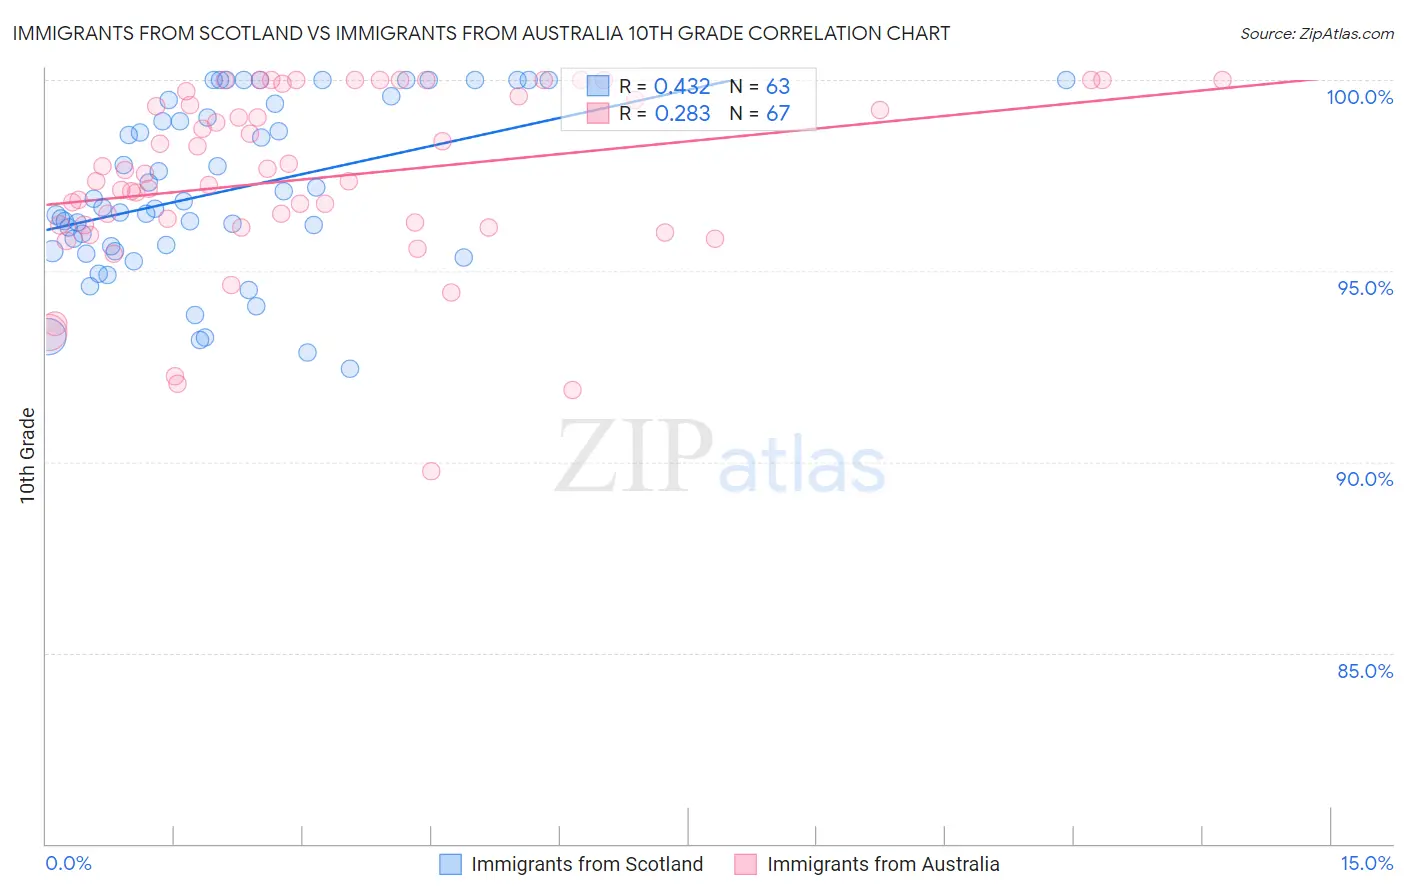
Immigrants from Scotland vs Immigrants from Australia 10th Grade Correlation Chart
The statistical analysis conducted on geographies consisting of 196,394,967 people shows a moderate positive correlation between the proportion of Immigrants from Scotland and percentage of population with at least 10th grade education in the United States with a correlation coefficient (R) of 0.432 and weighted average of 95.2%. Similarly, the statistical analysis conducted on geographies consisting of 227,202,695 people shows a weak positive correlation between the proportion of Immigrants from Australia and percentage of population with at least 10th grade education in the United States with a correlation coefficient (R) of 0.283 and weighted average of 94.9%, a difference of 0.33%.
10th Grade Correlation Summary
| Measurement | Immigrants from Scotland | Immigrants from Australia |
| Minimum | 92.4% | 89.8% |
| Maximum | 100.0% | 100.0% |
| Range | 7.6% | 10.2% |
| Mean | 97.1% | 97.4% |
| Median | 96.7% | 97.5% |
| Interquartile 25% (IQ1) | 95.5% | 96.2% |
| Interquartile 75% (IQ3) | 99.4% | 99.6% |
| Interquartile Range (IQR) | 3.8% | 3.4% |
| Standard Deviation (Sample) | 2.2% | 2.3% |
| Standard Deviation (Population) | 2.2% | 2.3% |
Similar Demographics by 10th Grade
Demographics Similar to Immigrants from Scotland by 10th Grade
In terms of 10th grade, the demographic groups most similar to Immigrants from Scotland are Scotch-Irish (95.2%, a difference of 0.0%), Northern European (95.3%, a difference of 0.020%), Russian (95.2%, a difference of 0.030%), French Canadian (95.3%, a difference of 0.060%), and Slavic (95.2%, a difference of 0.060%).
| Demographics | Rating | Rank | 10th Grade |
| Hungarians | 100.0 /100 | #32 | Exceptional 95.3% |
| French | 100.0 /100 | #33 | Exceptional 95.3% |
| British | 99.9 /100 | #34 | Exceptional 95.3% |
| Estonians | 99.9 /100 | #35 | Exceptional 95.3% |
| Immigrants | India | 99.9 /100 | #36 | Exceptional 95.3% |
| French Canadians | 99.9 /100 | #37 | Exceptional 95.3% |
| Northern Europeans | 99.9 /100 | #38 | Exceptional 95.3% |
| Immigrants | Scotland | 99.9 /100 | #39 | Exceptional 95.2% |
| Scotch-Irish | 99.9 /100 | #40 | Exceptional 95.2% |
| Russians | 99.9 /100 | #41 | Exceptional 95.2% |
| Slavs | 99.9 /100 | #42 | Exceptional 95.2% |
| Macedonians | 99.9 /100 | #43 | Exceptional 95.2% |
| Immigrants | Northern Europe | 99.9 /100 | #44 | Exceptional 95.2% |
| Greeks | 99.9 /100 | #45 | Exceptional 95.2% |
| Czechoslovakians | 99.9 /100 | #46 | Exceptional 95.1% |
Demographics Similar to Immigrants from Australia by 10th Grade
In terms of 10th grade, the demographic groups most similar to Immigrants from Australia are Immigrants from Netherlands (94.9%, a difference of 0.0%), Immigrants from Belgium (94.9%, a difference of 0.0%), Immigrants from England (94.9%, a difference of 0.020%), Zimbabwean (94.9%, a difference of 0.030%), and Alaska Native (94.9%, a difference of 0.030%).
| Demographics | Rating | Rank | 10th Grade |
| Celtics | 99.8 /100 | #59 | Exceptional 95.0% |
| Cypriots | 99.8 /100 | #60 | Exceptional 95.0% |
| Chippewa | 99.8 /100 | #61 | Exceptional 95.0% |
| Thais | 99.8 /100 | #62 | Exceptional 95.0% |
| Immigrants | Singapore | 99.8 /100 | #63 | Exceptional 95.0% |
| Native Hawaiians | 99.7 /100 | #64 | Exceptional 95.0% |
| Turks | 99.7 /100 | #65 | Exceptional 95.0% |
| Immigrants | Australia | 99.7 /100 | #66 | Exceptional 94.9% |
| Immigrants | Netherlands | 99.7 /100 | #67 | Exceptional 94.9% |
| Immigrants | Belgium | 99.7 /100 | #68 | Exceptional 94.9% |
| Immigrants | England | 99.6 /100 | #69 | Exceptional 94.9% |
| Zimbabweans | 99.6 /100 | #70 | Exceptional 94.9% |
| Alaska Natives | 99.6 /100 | #71 | Exceptional 94.9% |
| Immigrants | Sweden | 99.6 /100 | #72 | Exceptional 94.9% |
| Bhutanese | 99.6 /100 | #73 | Exceptional 94.9% |