Sri Lankan vs Immigrants from Northern Europe College, 1 year or more
COMPARE
Sri Lankan
Immigrants from Northern Europe
College, 1 year or more
College, 1 year or more Comparison
Sri Lankans
Immigrants from Northern Europe
59.4%
COLLEGE, 1 YEAR OR MORE
49.0/ 100
METRIC RATING
175th/ 347
METRIC RANK
65.6%
COLLEGE, 1 YEAR OR MORE
100.0/ 100
METRIC RATING
29th/ 347
METRIC RANK
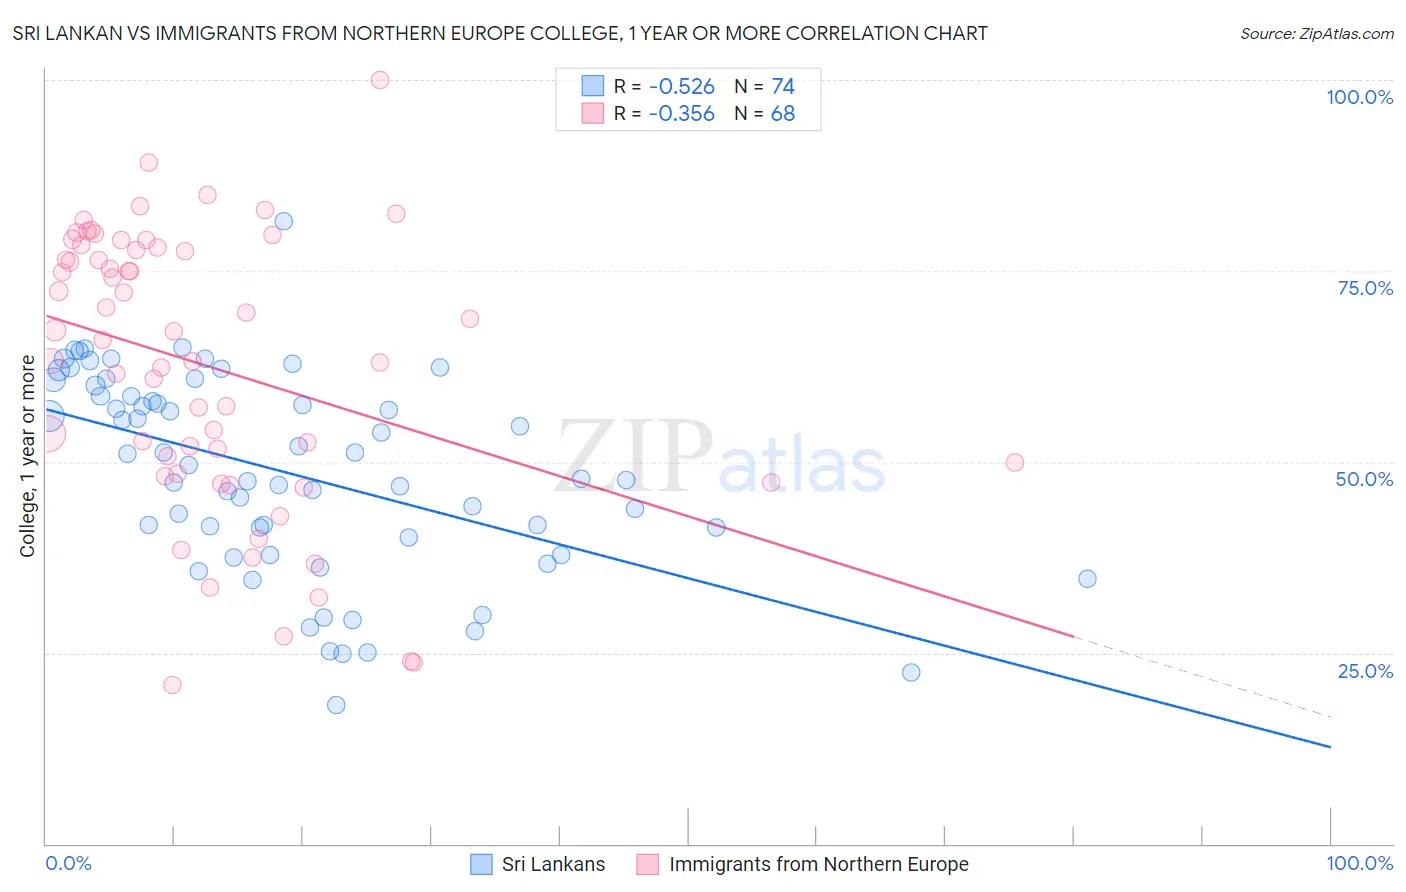
Sri Lankan vs Immigrants from Northern Europe College, 1 year or more Correlation Chart
The statistical analysis conducted on geographies consisting of 440,589,093 people shows a substantial negative correlation between the proportion of Sri Lankans and percentage of population with at least college, 1 year or more education in the United States with a correlation coefficient (R) of -0.526 and weighted average of 59.4%. Similarly, the statistical analysis conducted on geographies consisting of 477,221,622 people shows a mild negative correlation between the proportion of Immigrants from Northern Europe and percentage of population with at least college, 1 year or more education in the United States with a correlation coefficient (R) of -0.356 and weighted average of 65.6%, a difference of 10.6%.
College, 1 year or more Correlation Summary
| Measurement | Sri Lankan | Immigrants from Northern Europe |
| Minimum | 18.2% | 20.8% |
| Maximum | 81.5% | 100.0% |
| Range | 63.3% | 79.2% |
| Mean | 48.5% | 62.6% |
| Median | 48.6% | 66.5% |
| Interquartile 25% (IQ1) | 40.0% | 49.2% |
| Interquartile 75% (IQ3) | 58.6% | 77.9% |
| Interquartile Range (IQR) | 18.6% | 28.7% |
| Standard Deviation (Sample) | 13.0% | 18.2% |
| Standard Deviation (Population) | 12.9% | 18.0% |
Similar Demographics by College, 1 year or more
Demographics Similar to Sri Lankans by College, 1 year or more
In terms of college, 1 year or more, the demographic groups most similar to Sri Lankans are Immigrants from Poland (59.4%, a difference of 0.010%), Tlingit-Haida (59.4%, a difference of 0.030%), Czechoslovakian (59.4%, a difference of 0.040%), Celtic (59.4%, a difference of 0.050%), and Immigrants from Oceania (59.4%, a difference of 0.12%).
| Demographics | Rating | Rank | College, 1 year or more |
| Hungarians | 52.9 /100 | #168 | Average 59.5% |
| Immigrants | Southern Europe | 52.7 /100 | #169 | Average 59.5% |
| Welsh | 52.4 /100 | #170 | Average 59.5% |
| Immigrants | Albania | 52.3 /100 | #171 | Average 59.5% |
| Immigrants | Sierra Leone | 52.2 /100 | #172 | Average 59.5% |
| Immigrants | Oceania | 51.2 /100 | #173 | Average 59.4% |
| Celtics | 50.0 /100 | #174 | Average 59.4% |
| Sri Lankans | 49.0 /100 | #175 | Average 59.4% |
| Immigrants | Poland | 48.9 /100 | #176 | Average 59.4% |
| Tlingit-Haida | 48.4 /100 | #177 | Average 59.4% |
| Czechoslovakians | 48.3 /100 | #178 | Average 59.4% |
| Bermudans | 46.6 /100 | #179 | Average 59.3% |
| Yugoslavians | 44.1 /100 | #180 | Average 59.2% |
| Swiss | 43.4 /100 | #181 | Average 59.2% |
| Immigrants | Bosnia and Herzegovina | 42.8 /100 | #182 | Average 59.2% |
Demographics Similar to Immigrants from Northern Europe by College, 1 year or more
In terms of college, 1 year or more, the demographic groups most similar to Immigrants from Northern Europe are Immigrants from Denmark (65.6%, a difference of 0.11%), Turkish (65.5%, a difference of 0.19%), Bulgarian (65.5%, a difference of 0.24%), Immigrants from France (65.8%, a difference of 0.25%), and Immigrants from Sri Lanka (65.4%, a difference of 0.39%).
| Demographics | Rating | Rank | College, 1 year or more |
| Soviet Union | 100.0 /100 | #22 | Exceptional 66.4% |
| Immigrants | China | 100.0 /100 | #23 | Exceptional 66.4% |
| Immigrants | Belgium | 100.0 /100 | #24 | Exceptional 66.3% |
| Indians (Asian) | 100.0 /100 | #25 | Exceptional 66.1% |
| Latvians | 100.0 /100 | #26 | Exceptional 66.1% |
| Immigrants | Ireland | 100.0 /100 | #27 | Exceptional 65.9% |
| Immigrants | France | 100.0 /100 | #28 | Exceptional 65.8% |
| Immigrants | Northern Europe | 100.0 /100 | #29 | Exceptional 65.6% |
| Immigrants | Denmark | 100.0 /100 | #30 | Exceptional 65.6% |
| Turks | 100.0 /100 | #31 | Exceptional 65.5% |
| Bulgarians | 100.0 /100 | #32 | Exceptional 65.5% |
| Immigrants | Sri Lanka | 99.9 /100 | #33 | Exceptional 65.4% |
| Israelis | 99.9 /100 | #34 | Exceptional 65.3% |
| Immigrants | Turkey | 99.9 /100 | #35 | Exceptional 65.2% |
| Immigrants | South Africa | 99.9 /100 | #36 | Exceptional 65.1% |