Immigrants from Scotland vs Greek High School Diploma
COMPARE
Immigrants from Scotland
Greek
High School Diploma
High School Diploma Comparison
Immigrants from Scotland
Greeks
91.3%
HIGH SCHOOL DIPLOMA
99.8/ 100
METRIC RATING
38th/ 347
METRIC RANK
91.2%
HIGH SCHOOL DIPLOMA
99.8/ 100
METRIC RATING
46th/ 347
METRIC RANK
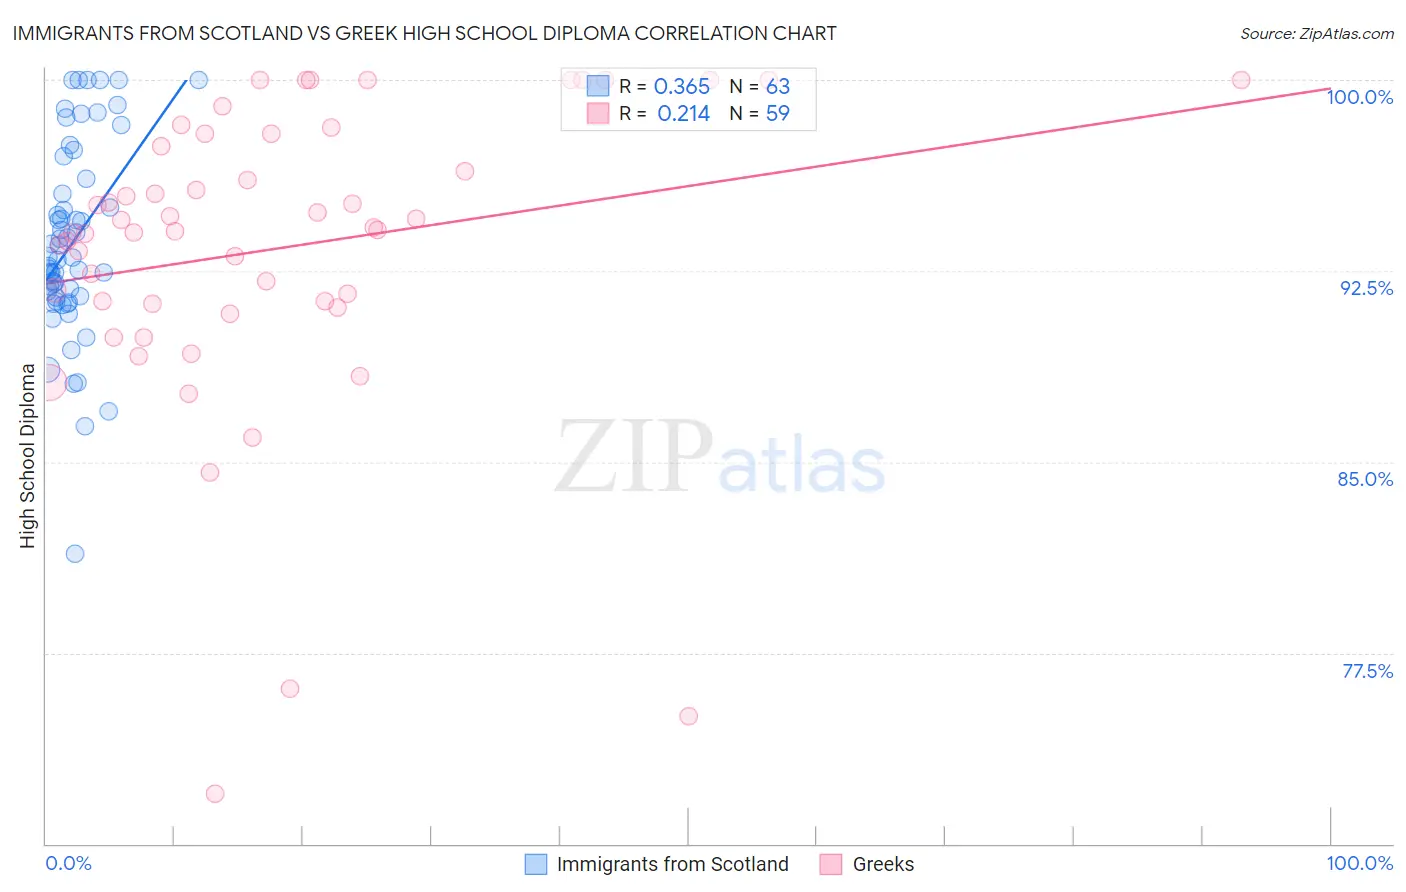
Immigrants from Scotland vs Greek High School Diploma Correlation Chart
The statistical analysis conducted on geographies consisting of 196,397,786 people shows a mild positive correlation between the proportion of Immigrants from Scotland and percentage of population with at least high school diploma education in the United States with a correlation coefficient (R) of 0.365 and weighted average of 91.3%. Similarly, the statistical analysis conducted on geographies consisting of 482,775,362 people shows a weak positive correlation between the proportion of Greeks and percentage of population with at least high school diploma education in the United States with a correlation coefficient (R) of 0.214 and weighted average of 91.2%, a difference of 0.11%.
High School Diploma Correlation Summary
| Measurement | Immigrants from Scotland | Greek |
| Minimum | 81.4% | 72.0% |
| Maximum | 100.0% | 100.0% |
| Range | 18.6% | 28.0% |
| Mean | 93.6% | 93.4% |
| Median | 93.0% | 94.1% |
| Interquartile 25% (IQ1) | 91.4% | 91.2% |
| Interquartile 75% (IQ3) | 96.1% | 97.9% |
| Interquartile Range (IQR) | 4.7% | 6.7% |
| Standard Deviation (Sample) | 3.8% | 5.9% |
| Standard Deviation (Population) | 3.8% | 5.9% |
Demographics Similar to Immigrants from Scotland and Greeks by High School Diploma
In terms of high school diploma, the demographic groups most similar to Immigrants from Scotland are Immigrants from Ireland (91.3%, a difference of 0.020%), Dutch (91.3%, a difference of 0.020%), Immigrants from Lithuania (91.3%, a difference of 0.020%), Tsimshian (91.3%, a difference of 0.040%), and Immigrants from Australia (91.3%, a difference of 0.040%). Similarly, the demographic groups most similar to Greeks are Australian (91.2%, a difference of 0.010%), Belgian (91.2%, a difference of 0.020%), Bhutanese (91.2%, a difference of 0.020%), Turkish (91.2%, a difference of 0.030%), and Immigrants from Austria (91.3%, a difference of 0.040%).
| Demographics | Rating | Rank | High School Diploma |
| English | 99.9 /100 | #32 | Exceptional 91.4% |
| Okinawans | 99.9 /100 | #33 | Exceptional 91.4% |
| Scottish | 99.9 /100 | #34 | Exceptional 91.4% |
| Irish | 99.9 /100 | #35 | Exceptional 91.4% |
| Tsimshian | 99.9 /100 | #36 | Exceptional 91.3% |
| Immigrants | Ireland | 99.9 /100 | #37 | Exceptional 91.3% |
| Immigrants | Scotland | 99.8 /100 | #38 | Exceptional 91.3% |
| Dutch | 99.8 /100 | #39 | Exceptional 91.3% |
| Immigrants | Lithuania | 99.8 /100 | #40 | Exceptional 91.3% |
| Immigrants | Australia | 99.8 /100 | #41 | Exceptional 91.3% |
| Northern Europeans | 99.8 /100 | #42 | Exceptional 91.3% |
| British | 99.8 /100 | #43 | Exceptional 91.3% |
| Immigrants | Austria | 99.8 /100 | #44 | Exceptional 91.3% |
| Turks | 99.8 /100 | #45 | Exceptional 91.2% |
| Greeks | 99.8 /100 | #46 | Exceptional 91.2% |
| Australians | 99.8 /100 | #47 | Exceptional 91.2% |
| Belgians | 99.8 /100 | #48 | Exceptional 91.2% |
| Bhutanese | 99.8 /100 | #49 | Exceptional 91.2% |
| Welsh | 99.8 /100 | #50 | Exceptional 91.2% |
| New Zealanders | 99.7 /100 | #51 | Exceptional 91.1% |
| Immigrants | Sweden | 99.7 /100 | #52 | Exceptional 91.1% |