Immigrants from Scotland vs Immigrants from Africa High School Diploma
COMPARE
Immigrants from Scotland
Immigrants from Africa
High School Diploma
High School Diploma Comparison
Immigrants from Scotland
Immigrants from Africa
91.3%
HIGH SCHOOL DIPLOMA
99.8/ 100
METRIC RATING
38th/ 347
METRIC RANK
88.4%
HIGH SCHOOL DIPLOMA
10.6/ 100
METRIC RATING
217th/ 347
METRIC RANK
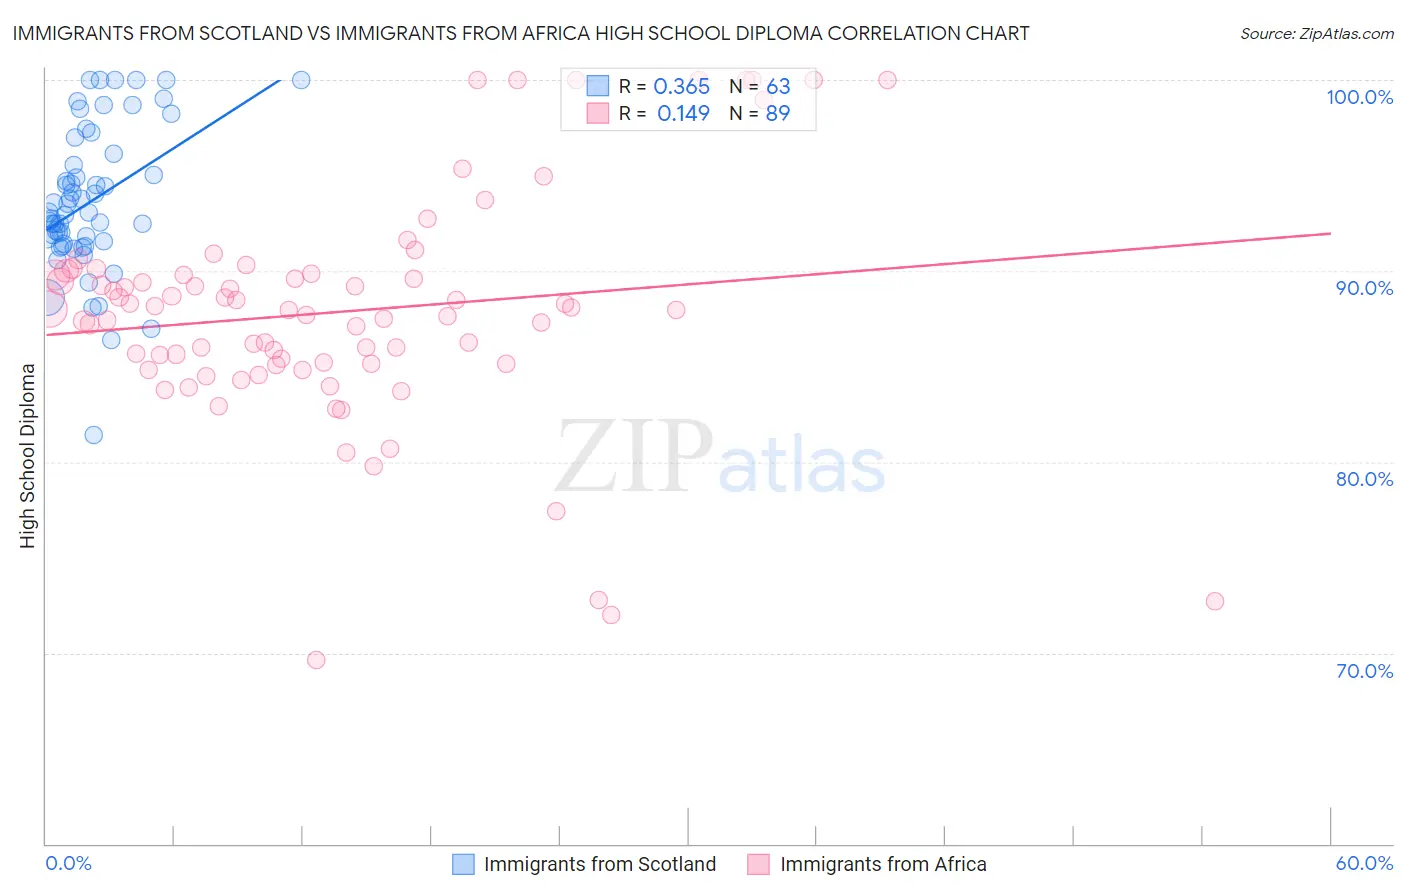
Immigrants from Scotland vs Immigrants from Africa High School Diploma Correlation Chart
The statistical analysis conducted on geographies consisting of 196,397,786 people shows a mild positive correlation between the proportion of Immigrants from Scotland and percentage of population with at least high school diploma education in the United States with a correlation coefficient (R) of 0.365 and weighted average of 91.3%. Similarly, the statistical analysis conducted on geographies consisting of 469,440,133 people shows a poor positive correlation between the proportion of Immigrants from Africa and percentage of population with at least high school diploma education in the United States with a correlation coefficient (R) of 0.149 and weighted average of 88.4%, a difference of 3.3%.
High School Diploma Correlation Summary
| Measurement | Immigrants from Scotland | Immigrants from Africa |
| Minimum | 81.4% | 69.6% |
| Maximum | 100.0% | 100.0% |
| Range | 18.6% | 30.4% |
| Mean | 93.6% | 87.9% |
| Median | 93.0% | 88.0% |
| Interquartile 25% (IQ1) | 91.4% | 85.1% |
| Interquartile 75% (IQ3) | 96.1% | 89.8% |
| Interquartile Range (IQR) | 4.7% | 4.7% |
| Standard Deviation (Sample) | 3.8% | 6.0% |
| Standard Deviation (Population) | 3.8% | 6.0% |
Similar Demographics by High School Diploma
Demographics Similar to Immigrants from Scotland by High School Diploma
In terms of high school diploma, the demographic groups most similar to Immigrants from Scotland are Immigrants from Ireland (91.3%, a difference of 0.020%), Dutch (91.3%, a difference of 0.020%), Immigrants from Lithuania (91.3%, a difference of 0.020%), Tsimshian (91.3%, a difference of 0.040%), and Immigrants from Australia (91.3%, a difference of 0.040%).
| Demographics | Rating | Rank | High School Diploma |
| Immigrants | Northern Europe | 99.9 /100 | #31 | Exceptional 91.4% |
| English | 99.9 /100 | #32 | Exceptional 91.4% |
| Okinawans | 99.9 /100 | #33 | Exceptional 91.4% |
| Scottish | 99.9 /100 | #34 | Exceptional 91.4% |
| Irish | 99.9 /100 | #35 | Exceptional 91.4% |
| Tsimshian | 99.9 /100 | #36 | Exceptional 91.3% |
| Immigrants | Ireland | 99.9 /100 | #37 | Exceptional 91.3% |
| Immigrants | Scotland | 99.8 /100 | #38 | Exceptional 91.3% |
| Dutch | 99.8 /100 | #39 | Exceptional 91.3% |
| Immigrants | Lithuania | 99.8 /100 | #40 | Exceptional 91.3% |
| Immigrants | Australia | 99.8 /100 | #41 | Exceptional 91.3% |
| Northern Europeans | 99.8 /100 | #42 | Exceptional 91.3% |
| British | 99.8 /100 | #43 | Exceptional 91.3% |
| Immigrants | Austria | 99.8 /100 | #44 | Exceptional 91.3% |
| Turks | 99.8 /100 | #45 | Exceptional 91.2% |
Demographics Similar to Immigrants from Africa by High School Diploma
In terms of high school diploma, the demographic groups most similar to Immigrants from Africa are Immigrants from Cameroon (88.4%, a difference of 0.010%), Crow (88.4%, a difference of 0.010%), Chickasaw (88.4%, a difference of 0.010%), Immigrants from Bolivia (88.4%, a difference of 0.010%), and Immigrants from Somalia (88.4%, a difference of 0.030%).
| Demographics | Rating | Rank | High School Diploma |
| Samoans | 14.0 /100 | #210 | Poor 88.5% |
| Inupiat | 13.1 /100 | #211 | Poor 88.5% |
| South American Indians | 12.2 /100 | #212 | Poor 88.5% |
| Immigrants | Somalia | 11.3 /100 | #213 | Poor 88.4% |
| Immigrants | Cameroon | 10.9 /100 | #214 | Poor 88.4% |
| Crow | 10.9 /100 | #215 | Poor 88.4% |
| Chickasaw | 10.7 /100 | #216 | Poor 88.4% |
| Immigrants | Africa | 10.6 /100 | #217 | Poor 88.4% |
| Immigrants | Bolivia | 10.3 /100 | #218 | Poor 88.4% |
| Costa Ricans | 9.6 /100 | #219 | Tragic 88.4% |
| Tongans | 9.5 /100 | #220 | Tragic 88.4% |
| Immigrants | Afghanistan | 8.6 /100 | #221 | Tragic 88.3% |
| Colville | 7.8 /100 | #222 | Tragic 88.3% |
| Immigrants | Zaire | 7.6 /100 | #223 | Tragic 88.3% |
| Shoshone | 7.0 /100 | #224 | Tragic 88.3% |