Immigrants from Turkey vs Estonian High School Diploma
COMPARE
Immigrants from Turkey
Estonian
High School Diploma
High School Diploma Comparison
Immigrants from Turkey
Estonians
90.6%
HIGH SCHOOL DIPLOMA
98.9/ 100
METRIC RATING
87th/ 347
METRIC RANK
91.6%
HIGH SCHOOL DIPLOMA
99.9/ 100
METRIC RATING
22nd/ 347
METRIC RANK
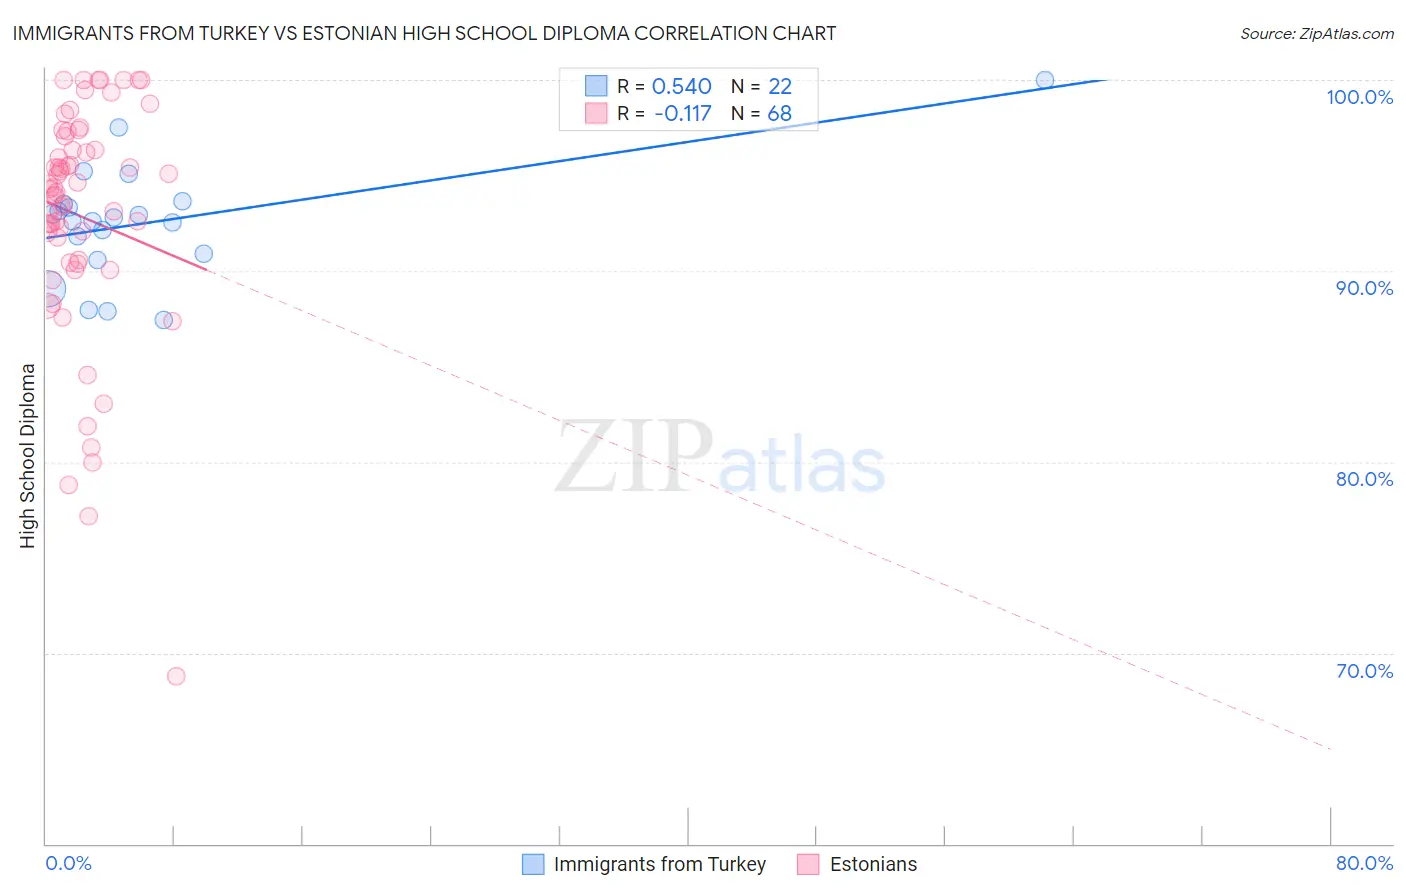
Immigrants from Turkey vs Estonian High School Diploma Correlation Chart
The statistical analysis conducted on geographies consisting of 223,057,877 people shows a substantial positive correlation between the proportion of Immigrants from Turkey and percentage of population with at least high school diploma education in the United States with a correlation coefficient (R) of 0.540 and weighted average of 90.6%. Similarly, the statistical analysis conducted on geographies consisting of 123,527,724 people shows a poor negative correlation between the proportion of Estonians and percentage of population with at least high school diploma education in the United States with a correlation coefficient (R) of -0.117 and weighted average of 91.6%, a difference of 1.0%.
High School Diploma Correlation Summary
| Measurement | Immigrants from Turkey | Estonian |
| Minimum | 87.4% | 68.8% |
| Maximum | 100.0% | 100.0% |
| Range | 12.6% | 31.2% |
| Mean | 92.5% | 92.9% |
| Median | 92.7% | 94.2% |
| Interquartile 25% (IQ1) | 90.9% | 90.5% |
| Interquartile 75% (IQ3) | 93.5% | 96.7% |
| Interquartile Range (IQR) | 2.6% | 6.2% |
| Standard Deviation (Sample) | 3.0% | 6.1% |
| Standard Deviation (Population) | 2.9% | 6.1% |
Similar Demographics by High School Diploma
Demographics Similar to Immigrants from Turkey by High School Diploma
In terms of high school diploma, the demographic groups most similar to Immigrants from Turkey are Immigrants from Bulgaria (90.6%, a difference of 0.0%), Romanian (90.7%, a difference of 0.010%), Immigrants from France (90.6%, a difference of 0.020%), Canadian (90.6%, a difference of 0.040%), and Celtic (90.6%, a difference of 0.050%).
| Demographics | Rating | Rank | High School Diploma |
| Immigrants | England | 99.3 /100 | #80 | Exceptional 90.8% |
| Immigrants | Switzerland | 99.3 /100 | #81 | Exceptional 90.8% |
| Scotch-Irish | 99.2 /100 | #82 | Exceptional 90.8% |
| Immigrants | Moldova | 99.2 /100 | #83 | Exceptional 90.7% |
| Immigrants | Saudi Arabia | 99.1 /100 | #84 | Exceptional 90.7% |
| Romanians | 98.9 /100 | #85 | Exceptional 90.7% |
| Immigrants | Bulgaria | 98.9 /100 | #86 | Exceptional 90.6% |
| Immigrants | Turkey | 98.9 /100 | #87 | Exceptional 90.6% |
| Immigrants | France | 98.8 /100 | #88 | Exceptional 90.6% |
| Canadians | 98.7 /100 | #89 | Exceptional 90.6% |
| Celtics | 98.7 /100 | #90 | Exceptional 90.6% |
| South Africans | 98.6 /100 | #91 | Exceptional 90.6% |
| Swiss | 98.6 /100 | #92 | Exceptional 90.6% |
| Immigrants | Western Europe | 98.6 /100 | #93 | Exceptional 90.6% |
| Immigrants | Israel | 98.5 /100 | #94 | Exceptional 90.5% |
Demographics Similar to Estonians by High School Diploma
In terms of high school diploma, the demographic groups most similar to Estonians are Filipino (91.6%, a difference of 0.010%), Czech (91.6%, a difference of 0.020%), Scandinavian (91.5%, a difference of 0.030%), Italian (91.5%, a difference of 0.030%), and Thai (91.5%, a difference of 0.030%).
| Demographics | Rating | Rank | High School Diploma |
| Luxembourgers | 100.0 /100 | #15 | Exceptional 91.7% |
| Finns | 100.0 /100 | #16 | Exceptional 91.7% |
| Immigrants | Singapore | 99.9 /100 | #17 | Exceptional 91.7% |
| Germans | 99.9 /100 | #18 | Exceptional 91.7% |
| Maltese | 99.9 /100 | #19 | Exceptional 91.6% |
| Czechs | 99.9 /100 | #20 | Exceptional 91.6% |
| Filipinos | 99.9 /100 | #21 | Exceptional 91.6% |
| Estonians | 99.9 /100 | #22 | Exceptional 91.6% |
| Scandinavians | 99.9 /100 | #23 | Exceptional 91.5% |
| Italians | 99.9 /100 | #24 | Exceptional 91.5% |
| Thais | 99.9 /100 | #25 | Exceptional 91.5% |
| Russians | 99.9 /100 | #26 | Exceptional 91.5% |
| Cypriots | 99.9 /100 | #27 | Exceptional 91.5% |
| Tlingit-Haida | 99.9 /100 | #28 | Exceptional 91.4% |
| Europeans | 99.9 /100 | #29 | Exceptional 91.4% |