Pueblo vs Yugoslavian 8th Grade
COMPARE
Pueblo
Yugoslavian
8th Grade
8th Grade Comparison
Pueblo
Yugoslavians
96.1%
8TH GRADE
92.3/ 100
METRIC RATING
131st/ 347
METRIC RANK
96.5%
8TH GRADE
99.4/ 100
METRIC RATING
78th/ 347
METRIC RANK
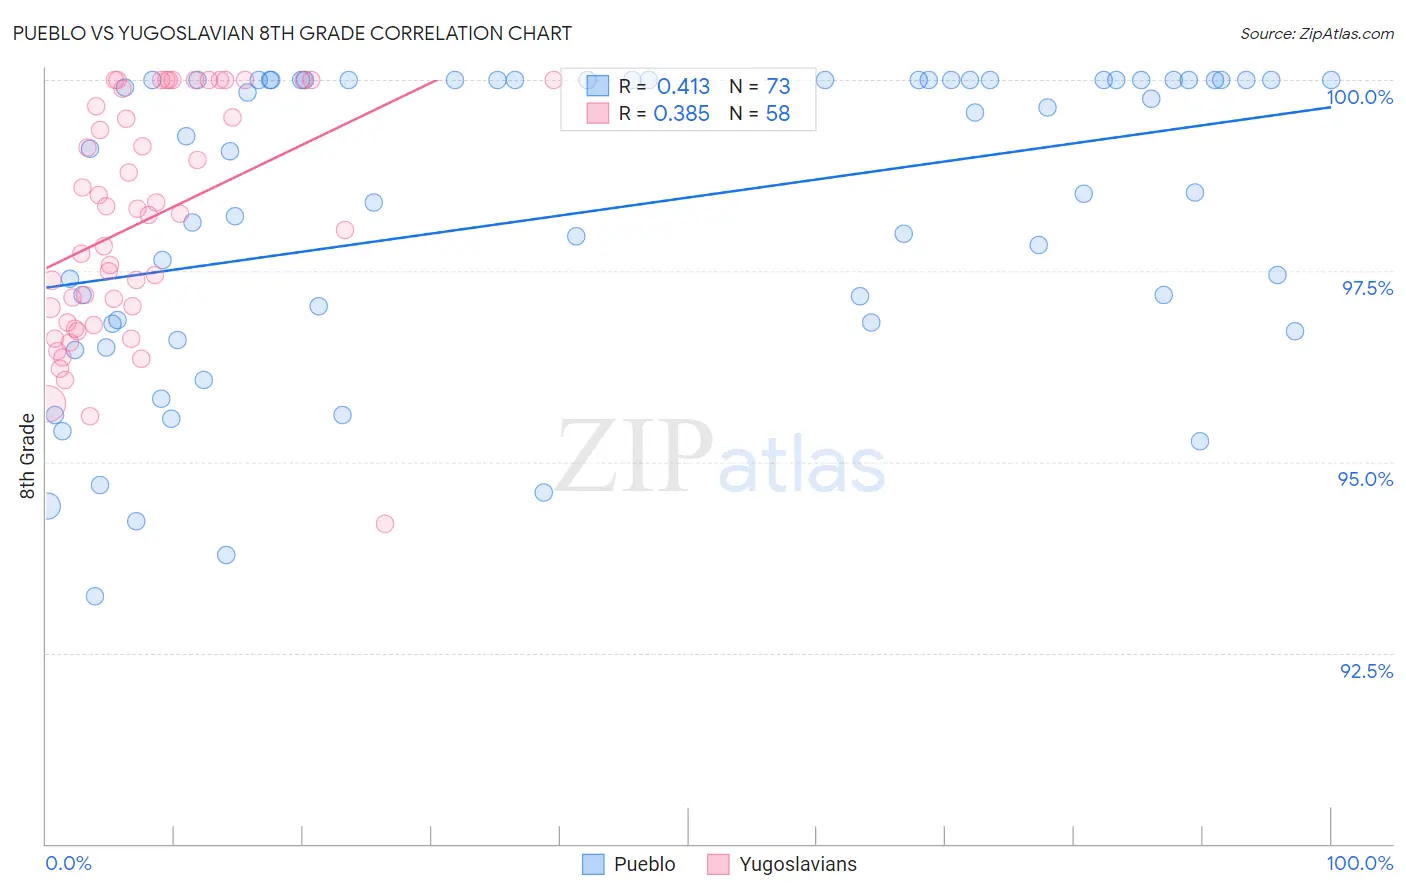
Pueblo vs Yugoslavian 8th Grade Correlation Chart
The statistical analysis conducted on geographies consisting of 120,086,078 people shows a moderate positive correlation between the proportion of Pueblo and percentage of population with at least 8th grade education in the United States with a correlation coefficient (R) of 0.413 and weighted average of 96.1%. Similarly, the statistical analysis conducted on geographies consisting of 285,618,157 people shows a mild positive correlation between the proportion of Yugoslavians and percentage of population with at least 8th grade education in the United States with a correlation coefficient (R) of 0.385 and weighted average of 96.5%, a difference of 0.42%.
8th Grade Correlation Summary
| Measurement | Pueblo | Yugoslavian |
| Minimum | 93.2% | 94.2% |
| Maximum | 100.0% | 100.0% |
| Range | 6.8% | 5.8% |
| Mean | 98.3% | 98.2% |
| Median | 99.1% | 98.2% |
| Interquartile 25% (IQ1) | 96.8% | 96.8% |
| Interquartile 75% (IQ3) | 100.0% | 99.9% |
| Interquartile Range (IQR) | 3.2% | 3.1% |
| Standard Deviation (Sample) | 2.0% | 1.5% |
| Standard Deviation (Population) | 2.0% | 1.5% |
Similar Demographics by 8th Grade
Demographics Similar to Pueblo by 8th Grade
In terms of 8th grade, the demographic groups most similar to Pueblo are Immigrants from Kuwait (96.1%, a difference of 0.0%), Soviet Union (96.1%, a difference of 0.010%), Immigrants from Turkey (96.1%, a difference of 0.010%), Cheyenne (96.1%, a difference of 0.020%), and Immigrants from Hungary (96.1%, a difference of 0.020%).
| Demographics | Rating | Rank | 8th Grade |
| Palestinians | 94.6 /100 | #124 | Exceptional 96.2% |
| Immigrants | Romania | 94.1 /100 | #125 | Exceptional 96.2% |
| Choctaw | 94.0 /100 | #126 | Exceptional 96.2% |
| Immigrants | Serbia | 94.0 /100 | #127 | Exceptional 96.2% |
| Immigrants | Bosnia and Herzegovina | 93.9 /100 | #128 | Exceptional 96.2% |
| Cheyenne | 93.3 /100 | #129 | Exceptional 96.1% |
| Soviet Union | 92.6 /100 | #130 | Exceptional 96.1% |
| Pueblo | 92.3 /100 | #131 | Exceptional 96.1% |
| Immigrants | Kuwait | 92.2 /100 | #132 | Exceptional 96.1% |
| Immigrants | Turkey | 91.7 /100 | #133 | Exceptional 96.1% |
| Immigrants | Hungary | 91.5 /100 | #134 | Exceptional 96.1% |
| Basques | 91.5 /100 | #135 | Exceptional 96.1% |
| Jordanians | 91.3 /100 | #136 | Exceptional 96.1% |
| Cambodians | 90.6 /100 | #137 | Exceptional 96.1% |
| Burmese | 90.2 /100 | #138 | Exceptional 96.1% |
Demographics Similar to Yugoslavians by 8th Grade
In terms of 8th grade, the demographic groups most similar to Yugoslavians are Cypriot (96.5%, a difference of 0.0%), Zimbabwean (96.5%, a difference of 0.010%), Immigrants from Netherlands (96.5%, a difference of 0.010%), Immigrants from Ireland (96.5%, a difference of 0.020%), and Puget Sound Salish (96.5%, a difference of 0.020%).
| Demographics | Rating | Rank | 8th Grade |
| New Zealanders | 99.5 /100 | #71 | Exceptional 96.6% |
| Immigrants | England | 99.5 /100 | #72 | Exceptional 96.6% |
| Arapaho | 99.5 /100 | #73 | Exceptional 96.6% |
| Immigrants | Ireland | 99.5 /100 | #74 | Exceptional 96.5% |
| Zimbabweans | 99.4 /100 | #75 | Exceptional 96.5% |
| Immigrants | Netherlands | 99.4 /100 | #76 | Exceptional 96.5% |
| Cypriots | 99.4 /100 | #77 | Exceptional 96.5% |
| Yugoslavians | 99.4 /100 | #78 | Exceptional 96.5% |
| Puget Sound Salish | 99.3 /100 | #79 | Exceptional 96.5% |
| Delaware | 99.2 /100 | #80 | Exceptional 96.5% |
| Romanians | 99.2 /100 | #81 | Exceptional 96.5% |
| Turks | 99.2 /100 | #82 | Exceptional 96.5% |
| Icelanders | 99.2 /100 | #83 | Exceptional 96.5% |
| Immigrants | Belgium | 99.1 /100 | #84 | Exceptional 96.5% |
| Immigrants | South Africa | 99.1 /100 | #85 | Exceptional 96.5% |