Immigrants from Saudi Arabia vs Immigrants from Brazil Professional Degree
COMPARE
Immigrants from Saudi Arabia
Immigrants from Brazil
Professional Degree
Professional Degree Comparison
Immigrants from Saudi Arabia
Immigrants from Brazil
5.9%
PROFESSIONAL DEGREE
100.0/ 100
METRIC RATING
43rd/ 347
METRIC RANK
5.3%
PROFESSIONAL DEGREE
99.6/ 100
METRIC RATING
81st/ 347
METRIC RANK
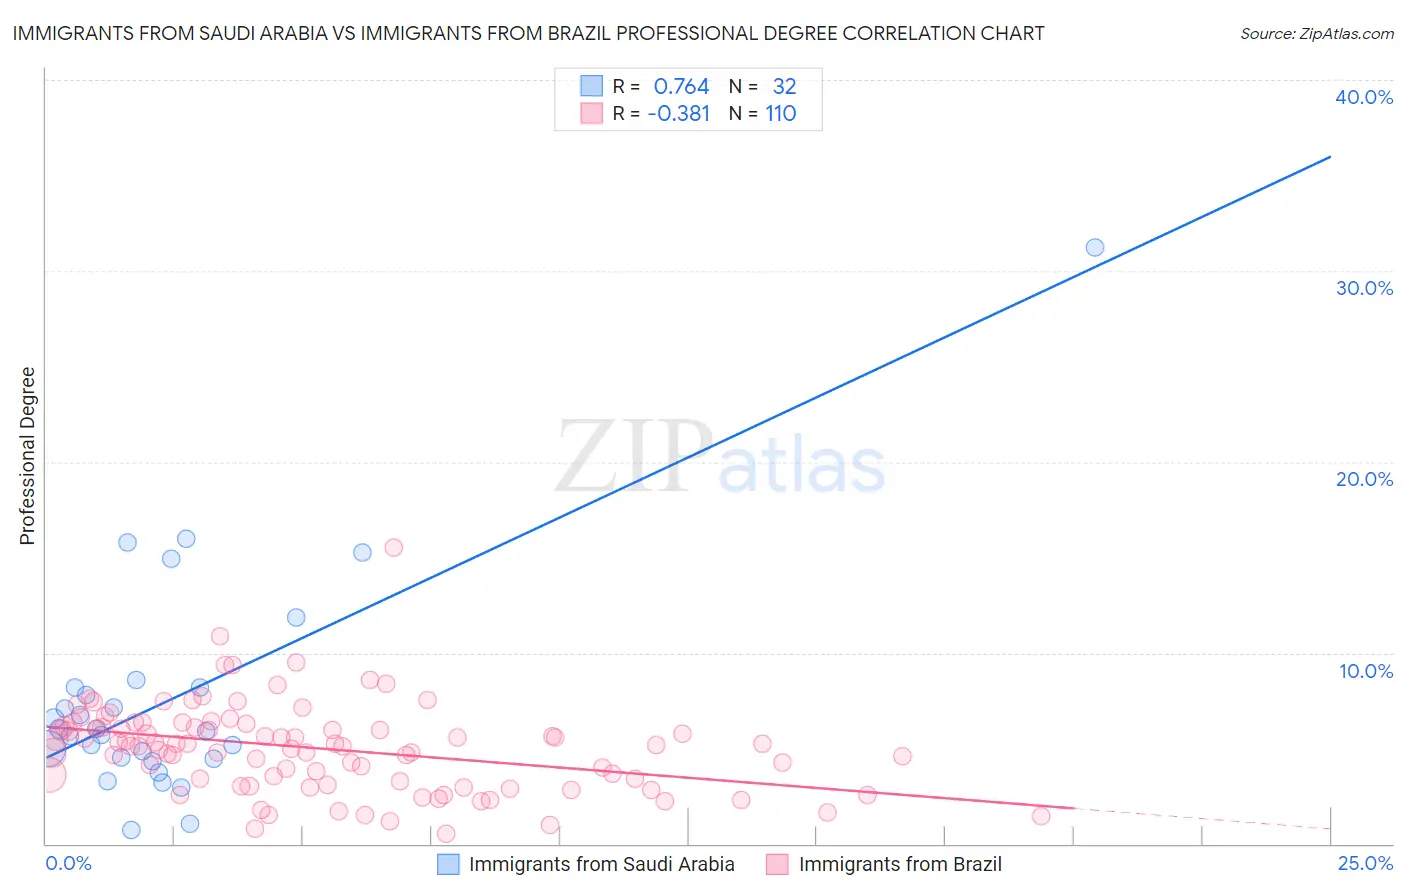
Immigrants from Saudi Arabia vs Immigrants from Brazil Professional Degree Correlation Chart
The statistical analysis conducted on geographies consisting of 164,208,779 people shows a strong positive correlation between the proportion of Immigrants from Saudi Arabia and percentage of population with at least professional degree education in the United States with a correlation coefficient (R) of 0.764 and weighted average of 5.9%. Similarly, the statistical analysis conducted on geographies consisting of 342,594,044 people shows a mild negative correlation between the proportion of Immigrants from Brazil and percentage of population with at least professional degree education in the United States with a correlation coefficient (R) of -0.381 and weighted average of 5.3%, a difference of 11.8%.
Professional Degree Correlation Summary
| Measurement | Immigrants from Saudi Arabia | Immigrants from Brazil |
| Minimum | 0.70% | 0.54% |
| Maximum | 31.2% | 15.5% |
| Range | 30.5% | 15.0% |
| Mean | 7.6% | 5.0% |
| Median | 5.9% | 5.2% |
| Interquartile 25% (IQ1) | 4.5% | 3.3% |
| Interquartile 75% (IQ3) | 8.2% | 6.1% |
| Interquartile Range (IQR) | 3.7% | 2.9% |
| Standard Deviation (Sample) | 5.9% | 2.3% |
| Standard Deviation (Population) | 5.8% | 2.3% |
Similar Demographics by Professional Degree
Demographics Similar to Immigrants from Saudi Arabia by Professional Degree
In terms of professional degree, the demographic groups most similar to Immigrants from Saudi Arabia are Argentinean (5.9%, a difference of 0.16%), Estonian (6.0%, a difference of 0.32%), New Zealander (6.0%, a difference of 0.33%), Cambodian (6.0%, a difference of 0.52%), and Immigrants from South Central Asia (5.9%, a difference of 0.61%).
| Demographics | Rating | Rank | Professional Degree |
| Immigrants | Russia | 100.0 /100 | #36 | Exceptional 6.0% |
| Immigrants | Austria | 100.0 /100 | #37 | Exceptional 6.0% |
| Immigrants | Norway | 100.0 /100 | #38 | Exceptional 6.0% |
| Immigrants | South Africa | 100.0 /100 | #39 | Exceptional 6.0% |
| Cambodians | 100.0 /100 | #40 | Exceptional 6.0% |
| New Zealanders | 100.0 /100 | #41 | Exceptional 6.0% |
| Estonians | 100.0 /100 | #42 | Exceptional 6.0% |
| Immigrants | Saudi Arabia | 100.0 /100 | #43 | Exceptional 5.9% |
| Argentineans | 100.0 /100 | #44 | Exceptional 5.9% |
| Immigrants | South Central Asia | 100.0 /100 | #45 | Exceptional 5.9% |
| Immigrants | Argentina | 100.0 /100 | #46 | Exceptional 5.9% |
| Australians | 100.0 /100 | #47 | Exceptional 5.9% |
| Paraguayans | 100.0 /100 | #48 | Exceptional 5.9% |
| Immigrants | Latvia | 100.0 /100 | #49 | Exceptional 5.8% |
| Immigrants | Czechoslovakia | 100.0 /100 | #50 | Exceptional 5.8% |
Demographics Similar to Immigrants from Brazil by Professional Degree
In terms of professional degree, the demographic groups most similar to Immigrants from Brazil are Immigrants from England (5.3%, a difference of 0.010%), Immigrants from North America (5.3%, a difference of 0.40%), Romanian (5.3%, a difference of 0.50%), Armenian (5.3%, a difference of 0.57%), and Immigrants from Ethiopia (5.3%, a difference of 0.61%).
| Demographics | Rating | Rank | Professional Degree |
| Ethiopians | 99.7 /100 | #74 | Exceptional 5.4% |
| Immigrants | Indonesia | 99.7 /100 | #75 | Exceptional 5.3% |
| Immigrants | Canada | 99.7 /100 | #76 | Exceptional 5.3% |
| Immigrants | Ethiopia | 99.7 /100 | #77 | Exceptional 5.3% |
| Armenians | 99.7 /100 | #78 | Exceptional 5.3% |
| Immigrants | North America | 99.7 /100 | #79 | Exceptional 5.3% |
| Immigrants | England | 99.6 /100 | #80 | Exceptional 5.3% |
| Immigrants | Brazil | 99.6 /100 | #81 | Exceptional 5.3% |
| Romanians | 99.6 /100 | #82 | Exceptional 5.3% |
| Carpatho Rusyns | 99.6 /100 | #83 | Exceptional 5.3% |
| Immigrants | Croatia | 99.6 /100 | #84 | Exceptional 5.3% |
| Immigrants | Zimbabwe | 99.6 /100 | #85 | Exceptional 5.3% |
| Greeks | 99.6 /100 | #86 | Exceptional 5.3% |
| Immigrants | Chile | 99.5 /100 | #87 | Exceptional 5.3% |
| Egyptians | 99.5 /100 | #88 | Exceptional 5.3% |