Immigrants from Saudi Arabia vs Nicaraguan Professional Degree
COMPARE
Immigrants from Saudi Arabia
Nicaraguan
Professional Degree
Professional Degree Comparison
Immigrants from Saudi Arabia
Nicaraguans
5.9%
PROFESSIONAL DEGREE
100.0/ 100
METRIC RATING
43rd/ 347
METRIC RANK
3.9%
PROFESSIONAL DEGREE
5.1/ 100
METRIC RATING
230th/ 347
METRIC RANK
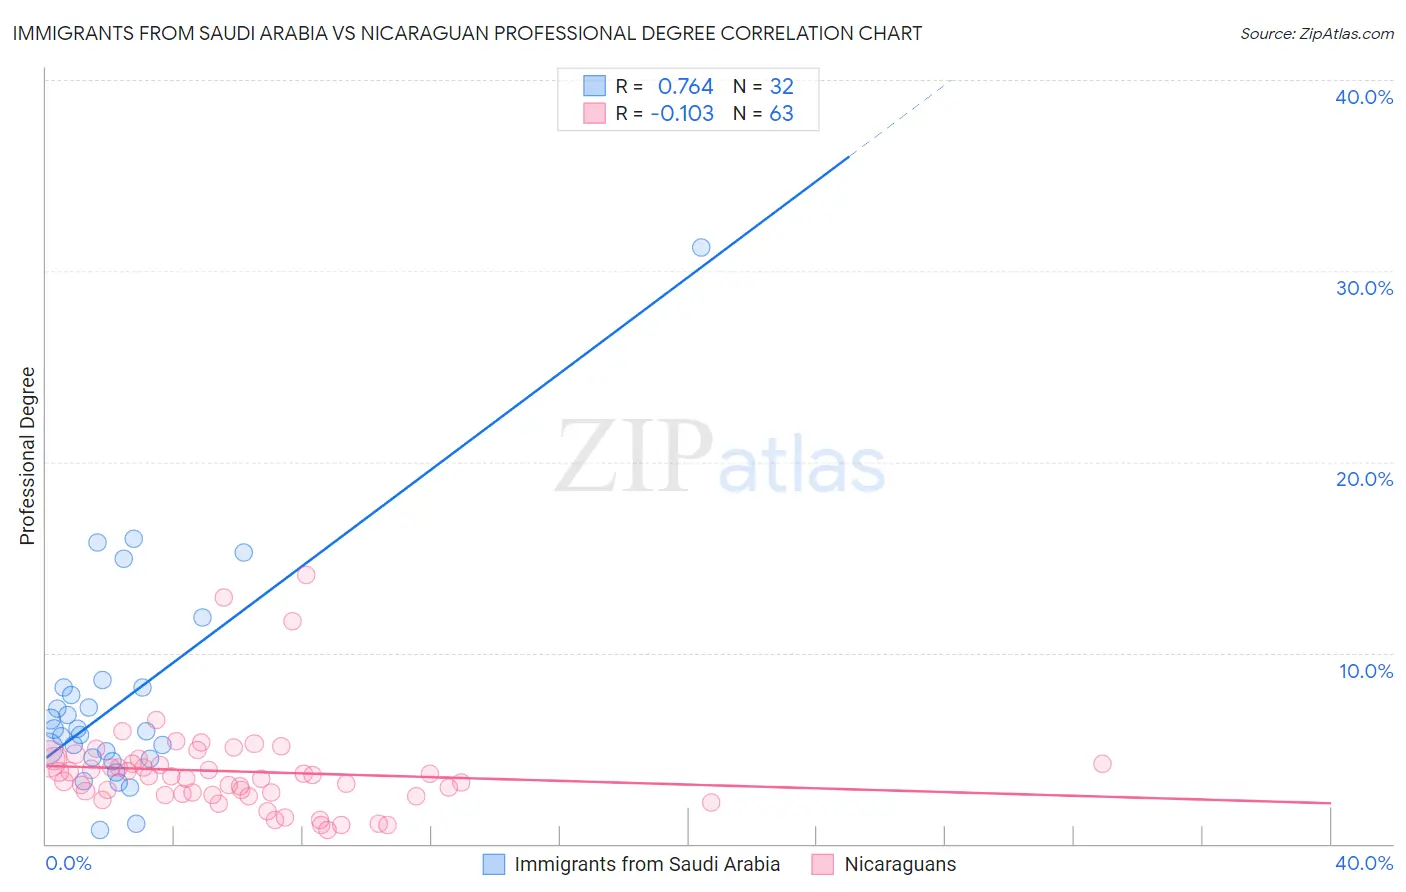
Immigrants from Saudi Arabia vs Nicaraguan Professional Degree Correlation Chart
The statistical analysis conducted on geographies consisting of 164,208,779 people shows a strong positive correlation between the proportion of Immigrants from Saudi Arabia and percentage of population with at least professional degree education in the United States with a correlation coefficient (R) of 0.764 and weighted average of 5.9%. Similarly, the statistical analysis conducted on geographies consisting of 285,287,812 people shows a poor negative correlation between the proportion of Nicaraguans and percentage of population with at least professional degree education in the United States with a correlation coefficient (R) of -0.103 and weighted average of 3.9%, a difference of 50.7%.
Professional Degree Correlation Summary
| Measurement | Immigrants from Saudi Arabia | Nicaraguan |
| Minimum | 0.70% | 0.72% |
| Maximum | 31.2% | 14.1% |
| Range | 30.5% | 13.4% |
| Mean | 7.6% | 3.8% |
| Median | 5.9% | 3.5% |
| Interquartile 25% (IQ1) | 4.5% | 2.6% |
| Interquartile 75% (IQ3) | 8.2% | 4.4% |
| Interquartile Range (IQR) | 3.7% | 1.8% |
| Standard Deviation (Sample) | 5.9% | 2.4% |
| Standard Deviation (Population) | 5.8% | 2.4% |
Similar Demographics by Professional Degree
Demographics Similar to Immigrants from Saudi Arabia by Professional Degree
In terms of professional degree, the demographic groups most similar to Immigrants from Saudi Arabia are Argentinean (5.9%, a difference of 0.16%), Estonian (6.0%, a difference of 0.32%), New Zealander (6.0%, a difference of 0.33%), Cambodian (6.0%, a difference of 0.52%), and Immigrants from South Central Asia (5.9%, a difference of 0.61%).
| Demographics | Rating | Rank | Professional Degree |
| Immigrants | Russia | 100.0 /100 | #36 | Exceptional 6.0% |
| Immigrants | Austria | 100.0 /100 | #37 | Exceptional 6.0% |
| Immigrants | Norway | 100.0 /100 | #38 | Exceptional 6.0% |
| Immigrants | South Africa | 100.0 /100 | #39 | Exceptional 6.0% |
| Cambodians | 100.0 /100 | #40 | Exceptional 6.0% |
| New Zealanders | 100.0 /100 | #41 | Exceptional 6.0% |
| Estonians | 100.0 /100 | #42 | Exceptional 6.0% |
| Immigrants | Saudi Arabia | 100.0 /100 | #43 | Exceptional 5.9% |
| Argentineans | 100.0 /100 | #44 | Exceptional 5.9% |
| Immigrants | South Central Asia | 100.0 /100 | #45 | Exceptional 5.9% |
| Immigrants | Argentina | 100.0 /100 | #46 | Exceptional 5.9% |
| Australians | 100.0 /100 | #47 | Exceptional 5.9% |
| Paraguayans | 100.0 /100 | #48 | Exceptional 5.9% |
| Immigrants | Latvia | 100.0 /100 | #49 | Exceptional 5.8% |
| Immigrants | Czechoslovakia | 100.0 /100 | #50 | Exceptional 5.8% |
Demographics Similar to Nicaraguans by Professional Degree
In terms of professional degree, the demographic groups most similar to Nicaraguans are Immigrants from Burma/Myanmar (3.9%, a difference of 0.27%), Immigrants from West Indies (4.0%, a difference of 0.42%), Ecuadorian (3.9%, a difference of 0.46%), Cuban (4.0%, a difference of 0.67%), and Cree (3.9%, a difference of 0.67%).
| Demographics | Rating | Rank | Professional Degree |
| Immigrants | Bosnia and Herzegovina | 7.4 /100 | #223 | Tragic 4.0% |
| Trinidadians and Tobagonians | 7.1 /100 | #224 | Tragic 4.0% |
| Tlingit-Haida | 6.9 /100 | #225 | Tragic 4.0% |
| German Russians | 6.1 /100 | #226 | Tragic 4.0% |
| Cubans | 5.9 /100 | #227 | Tragic 4.0% |
| Immigrants | West Indies | 5.6 /100 | #228 | Tragic 4.0% |
| Immigrants | Burma/Myanmar | 5.4 /100 | #229 | Tragic 3.9% |
| Nicaraguans | 5.1 /100 | #230 | Tragic 3.9% |
| Ecuadorians | 4.6 /100 | #231 | Tragic 3.9% |
| Cree | 4.3 /100 | #232 | Tragic 3.9% |
| Immigrants | Philippines | 4.1 /100 | #233 | Tragic 3.9% |
| Immigrants | Nonimmigrants | 4.0 /100 | #234 | Tragic 3.9% |
| Immigrants | Barbados | 4.0 /100 | #235 | Tragic 3.9% |
| Spanish Americans | 3.8 /100 | #236 | Tragic 3.9% |
| Immigrants | Trinidad and Tobago | 3.8 /100 | #237 | Tragic 3.9% |