Immigrants from Saudi Arabia vs Immigrants from Belgium 10th Grade
COMPARE
Immigrants from Saudi Arabia
Immigrants from Belgium
10th Grade
10th Grade Comparison
Immigrants from Saudi Arabia
Immigrants from Belgium
94.7%
10TH GRADE
99.0/ 100
METRIC RATING
87th/ 347
METRIC RANK
94.9%
10TH GRADE
99.7/ 100
METRIC RATING
68th/ 347
METRIC RANK
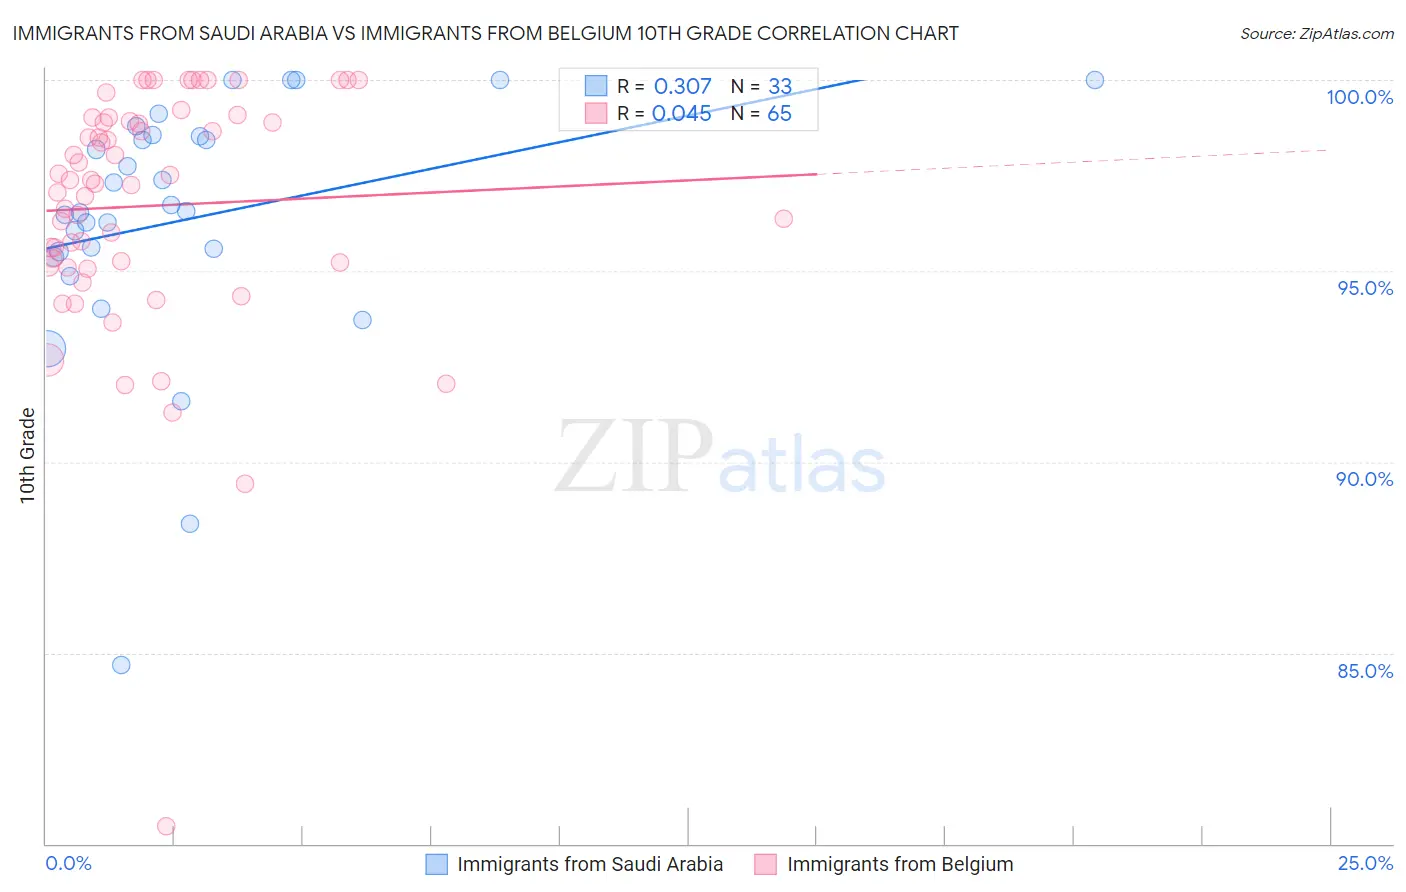
Immigrants from Saudi Arabia vs Immigrants from Belgium 10th Grade Correlation Chart
The statistical analysis conducted on geographies consisting of 164,277,573 people shows a mild positive correlation between the proportion of Immigrants from Saudi Arabia and percentage of population with at least 10th grade education in the United States with a correlation coefficient (R) of 0.307 and weighted average of 94.7%. Similarly, the statistical analysis conducted on geographies consisting of 146,727,969 people shows no correlation between the proportion of Immigrants from Belgium and percentage of population with at least 10th grade education in the United States with a correlation coefficient (R) of 0.045 and weighted average of 94.9%, a difference of 0.24%.
10th Grade Correlation Summary
| Measurement | Immigrants from Saudi Arabia | Immigrants from Belgium |
| Minimum | 84.7% | 80.4% |
| Maximum | 100.0% | 100.0% |
| Range | 15.3% | 19.6% |
| Mean | 96.4% | 96.7% |
| Median | 96.6% | 97.4% |
| Interquartile 25% (IQ1) | 95.4% | 95.2% |
| Interquartile 75% (IQ3) | 98.5% | 99.0% |
| Interquartile Range (IQR) | 3.1% | 3.8% |
| Standard Deviation (Sample) | 3.3% | 3.3% |
| Standard Deviation (Population) | 3.3% | 3.2% |
Demographics Similar to Immigrants from Saudi Arabia and Immigrants from Belgium by 10th Grade
In terms of 10th grade, the demographic groups most similar to Immigrants from Saudi Arabia are Crow (94.7%, a difference of 0.010%), Puget Sound Salish (94.7%, a difference of 0.010%), Immigrants from Western Europe (94.7%, a difference of 0.020%), Icelander (94.7%, a difference of 0.020%), and Swiss (94.7%, a difference of 0.030%). Similarly, the demographic groups most similar to Immigrants from Belgium are Immigrants from Netherlands (94.9%, a difference of 0.0%), Immigrants from England (94.9%, a difference of 0.010%), Zimbabwean (94.9%, a difference of 0.030%), Alaska Native (94.9%, a difference of 0.030%), and Immigrants from Sweden (94.9%, a difference of 0.040%).
| Demographics | Rating | Rank | 10th Grade |
| Immigrants | Netherlands | 99.7 /100 | #67 | Exceptional 94.9% |
| Immigrants | Belgium | 99.7 /100 | #68 | Exceptional 94.9% |
| Immigrants | England | 99.6 /100 | #69 | Exceptional 94.9% |
| Zimbabweans | 99.6 /100 | #70 | Exceptional 94.9% |
| Alaska Natives | 99.6 /100 | #71 | Exceptional 94.9% |
| Immigrants | Sweden | 99.6 /100 | #72 | Exceptional 94.9% |
| Bhutanese | 99.6 /100 | #73 | Exceptional 94.9% |
| Canadians | 99.6 /100 | #74 | Exceptional 94.9% |
| Okinawans | 99.5 /100 | #75 | Exceptional 94.8% |
| Romanians | 99.5 /100 | #76 | Exceptional 94.8% |
| Immigrants | South Africa | 99.5 /100 | #77 | Exceptional 94.8% |
| Filipinos | 99.3 /100 | #78 | Exceptional 94.8% |
| Immigrants | Czechoslovakia | 99.2 /100 | #79 | Exceptional 94.7% |
| Immigrants | Denmark | 99.2 /100 | #80 | Exceptional 94.7% |
| Immigrants | Latvia | 99.2 /100 | #81 | Exceptional 94.7% |
| Swiss | 99.1 /100 | #82 | Exceptional 94.7% |
| Immigrants | Western Europe | 99.1 /100 | #83 | Exceptional 94.7% |
| Icelanders | 99.1 /100 | #84 | Exceptional 94.7% |
| Crow | 99.0 /100 | #85 | Exceptional 94.7% |
| Puget Sound Salish | 99.0 /100 | #86 | Exceptional 94.7% |
| Immigrants | Saudi Arabia | 99.0 /100 | #87 | Exceptional 94.7% |