Immigrants from Saudi Arabia vs Immigrants from Guatemala 10th Grade
COMPARE
Immigrants from Saudi Arabia
Immigrants from Guatemala
10th Grade
10th Grade Comparison
Immigrants from Saudi Arabia
Immigrants from Guatemala
94.7%
10TH GRADE
99.0/ 100
METRIC RATING
87th/ 347
METRIC RANK
87.4%
10TH GRADE
0.0/ 100
METRIC RATING
342nd/ 347
METRIC RANK
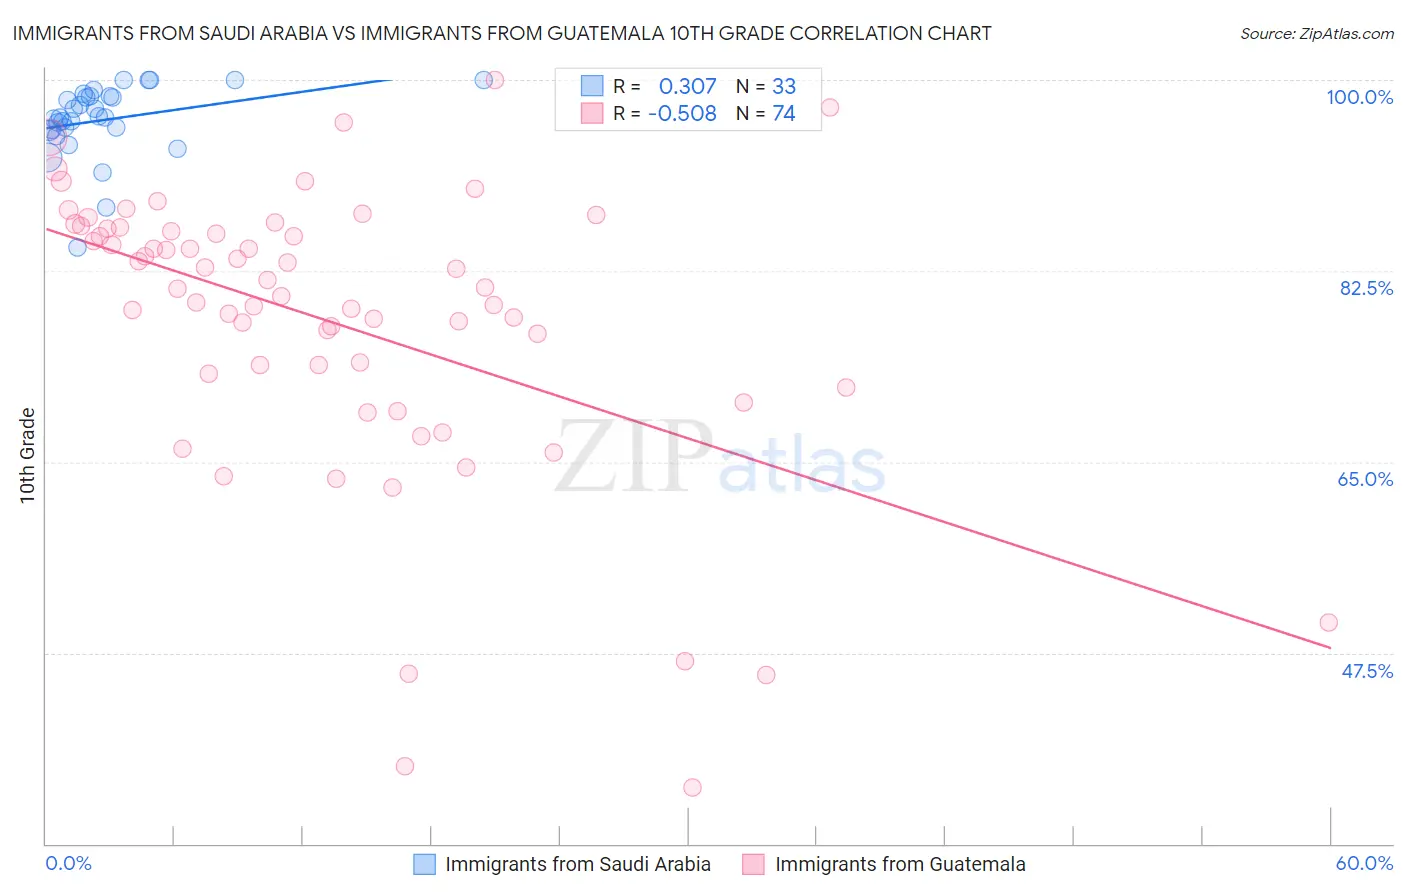
Immigrants from Saudi Arabia vs Immigrants from Guatemala 10th Grade Correlation Chart
The statistical analysis conducted on geographies consisting of 164,277,573 people shows a mild positive correlation between the proportion of Immigrants from Saudi Arabia and percentage of population with at least 10th grade education in the United States with a correlation coefficient (R) of 0.307 and weighted average of 94.7%. Similarly, the statistical analysis conducted on geographies consisting of 377,286,142 people shows a substantial negative correlation between the proportion of Immigrants from Guatemala and percentage of population with at least 10th grade education in the United States with a correlation coefficient (R) of -0.508 and weighted average of 87.4%, a difference of 8.4%.
10th Grade Correlation Summary
| Measurement | Immigrants from Saudi Arabia | Immigrants from Guatemala |
| Minimum | 84.7% | 35.2% |
| Maximum | 100.0% | 100.0% |
| Range | 15.3% | 64.8% |
| Mean | 96.4% | 77.9% |
| Median | 96.6% | 80.9% |
| Interquartile 25% (IQ1) | 95.4% | 73.1% |
| Interquartile 75% (IQ3) | 98.5% | 86.4% |
| Interquartile Range (IQR) | 3.1% | 13.3% |
| Standard Deviation (Sample) | 3.3% | 13.3% |
| Standard Deviation (Population) | 3.3% | 13.2% |
Similar Demographics by 10th Grade
Demographics Similar to Immigrants from Saudi Arabia by 10th Grade
In terms of 10th grade, the demographic groups most similar to Immigrants from Saudi Arabia are Immigrants from Japan (94.7%, a difference of 0.0%), Crow (94.7%, a difference of 0.010%), Puget Sound Salish (94.7%, a difference of 0.010%), Immigrants from Western Europe (94.7%, a difference of 0.020%), and Icelander (94.7%, a difference of 0.020%).
| Demographics | Rating | Rank | 10th Grade |
| Immigrants | Denmark | 99.2 /100 | #80 | Exceptional 94.7% |
| Immigrants | Latvia | 99.2 /100 | #81 | Exceptional 94.7% |
| Swiss | 99.1 /100 | #82 | Exceptional 94.7% |
| Immigrants | Western Europe | 99.1 /100 | #83 | Exceptional 94.7% |
| Icelanders | 99.1 /100 | #84 | Exceptional 94.7% |
| Crow | 99.0 /100 | #85 | Exceptional 94.7% |
| Puget Sound Salish | 99.0 /100 | #86 | Exceptional 94.7% |
| Immigrants | Saudi Arabia | 99.0 /100 | #87 | Exceptional 94.7% |
| Immigrants | Japan | 99.0 /100 | #88 | Exceptional 94.7% |
| Immigrants | Moldova | 98.9 /100 | #89 | Exceptional 94.7% |
| South Africans | 98.8 /100 | #90 | Exceptional 94.7% |
| Whites/Caucasians | 98.8 /100 | #91 | Exceptional 94.7% |
| Yugoslavians | 98.4 /100 | #92 | Exceptional 94.6% |
| Soviet Union | 98.3 /100 | #93 | Exceptional 94.6% |
| Immigrants | Germany | 98.3 /100 | #94 | Exceptional 94.6% |
Demographics Similar to Immigrants from Guatemala by 10th Grade
In terms of 10th grade, the demographic groups most similar to Immigrants from Guatemala are Salvadoran (87.5%, a difference of 0.16%), Mexican (87.8%, a difference of 0.44%), Yakama (86.9%, a difference of 0.58%), Guatemalan (87.9%, a difference of 0.60%), and Immigrants from El Salvador (86.8%, a difference of 0.72%).
| Demographics | Rating | Rank | 10th Grade |
| Hondurans | 0.0 /100 | #333 | Tragic 89.0% |
| Hispanics or Latinos | 0.0 /100 | #334 | Tragic 88.9% |
| Immigrants | Dominican Republic | 0.0 /100 | #335 | Tragic 88.7% |
| Immigrants | Honduras | 0.0 /100 | #336 | Tragic 88.5% |
| Central Americans | 0.0 /100 | #337 | Tragic 88.4% |
| Immigrants | Latin America | 0.0 /100 | #338 | Tragic 88.3% |
| Guatemalans | 0.0 /100 | #339 | Tragic 87.9% |
| Mexicans | 0.0 /100 | #340 | Tragic 87.8% |
| Salvadorans | 0.0 /100 | #341 | Tragic 87.5% |
| Immigrants | Guatemala | 0.0 /100 | #342 | Tragic 87.4% |
| Yakama | 0.0 /100 | #343 | Tragic 86.9% |
| Immigrants | El Salvador | 0.0 /100 | #344 | Tragic 86.8% |
| Immigrants | Central America | 0.0 /100 | #345 | Tragic 86.6% |
| Spanish American Indians | 0.0 /100 | #346 | Tragic 86.2% |
| Immigrants | Mexico | 0.0 /100 | #347 | Tragic 86.2% |