Immigrants from Russia vs Nepalese In Labor Force | Age 20-24
COMPARE
Immigrants from Russia
Nepalese
In Labor Force | Age 20-24
In Labor Force | Age 20-24 Comparison
Immigrants from Russia
Nepalese
73.5%
IN LABOR FORCE | AGE 20-24
0.3/ 100
METRIC RATING
270th/ 347
METRIC RANK
74.5%
IN LABOR FORCE | AGE 20-24
10.5/ 100
METRIC RATING
219th/ 347
METRIC RANK
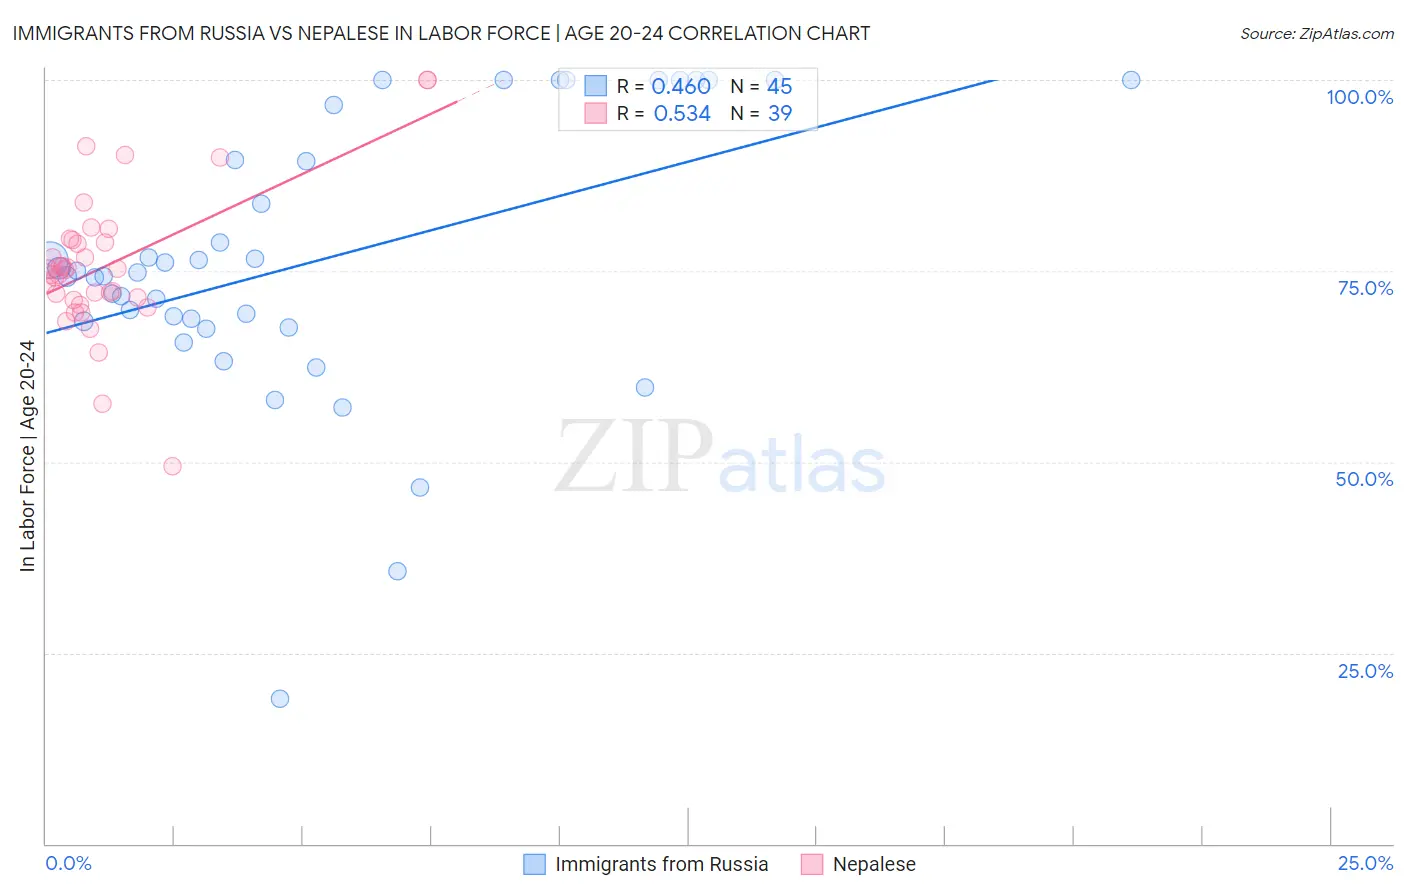
Immigrants from Russia vs Nepalese In Labor Force | Age 20-24 Correlation Chart
The statistical analysis conducted on geographies consisting of 347,833,174 people shows a moderate positive correlation between the proportion of Immigrants from Russia and labor force participation rate among population between the ages 20 and 24 in the United States with a correlation coefficient (R) of 0.460 and weighted average of 73.5%. Similarly, the statistical analysis conducted on geographies consisting of 24,516,862 people shows a substantial positive correlation between the proportion of Nepalese and labor force participation rate among population between the ages 20 and 24 in the United States with a correlation coefficient (R) of 0.534 and weighted average of 74.5%, a difference of 1.4%.
In Labor Force | Age 20-24 Correlation Summary
| Measurement | Immigrants from Russia | Nepalese |
| Minimum | 19.0% | 49.5% |
| Maximum | 100.0% | 100.0% |
| Range | 81.0% | 50.5% |
| Mean | 76.3% | 75.7% |
| Median | 74.8% | 75.1% |
| Interquartile 25% (IQ1) | 68.0% | 71.2% |
| Interquartile 75% (IQ3) | 93.2% | 79.0% |
| Interquartile Range (IQR) | 25.2% | 7.9% |
| Standard Deviation (Sample) | 18.0% | 9.6% |
| Standard Deviation (Population) | 17.8% | 9.5% |
Similar Demographics by In Labor Force | Age 20-24
Demographics Similar to Immigrants from Russia by In Labor Force | Age 20-24
In terms of in labor force | age 20-24, the demographic groups most similar to Immigrants from Russia are Colombian (73.5%, a difference of 0.030%), Immigrants from Indonesia (73.4%, a difference of 0.050%), South American (73.5%, a difference of 0.060%), Belizean (73.4%, a difference of 0.060%), and Cheyenne (73.4%, a difference of 0.090%).
| Demographics | Rating | Rank | In Labor Force | Age 20-24 |
| Immigrants | Asia | 0.5 /100 | #263 | Tragic 73.6% |
| Immigrants | Haiti | 0.5 /100 | #264 | Tragic 73.6% |
| Burmese | 0.5 /100 | #265 | Tragic 73.6% |
| Haitians | 0.5 /100 | #266 | Tragic 73.6% |
| Immigrants | Western Asia | 0.4 /100 | #267 | Tragic 73.5% |
| South Americans | 0.4 /100 | #268 | Tragic 73.5% |
| Colombians | 0.3 /100 | #269 | Tragic 73.5% |
| Immigrants | Russia | 0.3 /100 | #270 | Tragic 73.5% |
| Immigrants | Indonesia | 0.3 /100 | #271 | Tragic 73.4% |
| Belizeans | 0.3 /100 | #272 | Tragic 73.4% |
| Cheyenne | 0.2 /100 | #273 | Tragic 73.4% |
| Immigrants | Colombia | 0.2 /100 | #274 | Tragic 73.4% |
| Immigrants | South America | 0.2 /100 | #275 | Tragic 73.3% |
| Mongolians | 0.2 /100 | #276 | Tragic 73.3% |
| Immigrants | Malaysia | 0.2 /100 | #277 | Tragic 73.3% |
Demographics Similar to Nepalese by In Labor Force | Age 20-24
In terms of in labor force | age 20-24, the demographic groups most similar to Nepalese are Immigrants from Peru (74.5%, a difference of 0.0%), Immigrants from Norway (74.5%, a difference of 0.010%), Chickasaw (74.5%, a difference of 0.010%), Immigrants from India (74.4%, a difference of 0.030%), and Chilean (74.5%, a difference of 0.070%).
| Demographics | Rating | Rank | In Labor Force | Age 20-24 |
| Creek | 13.3 /100 | #212 | Poor 74.5% |
| Peruvians | 13.3 /100 | #213 | Poor 74.5% |
| Immigrants | Southern Europe | 13.2 /100 | #214 | Poor 74.5% |
| Immigrants | Ghana | 12.7 /100 | #215 | Poor 74.5% |
| Immigrants | Kuwait | 12.7 /100 | #216 | Poor 74.5% |
| Chileans | 12.5 /100 | #217 | Poor 74.5% |
| Immigrants | Peru | 10.6 /100 | #218 | Poor 74.5% |
| Nepalese | 10.5 /100 | #219 | Poor 74.5% |
| Immigrants | Norway | 10.3 /100 | #220 | Poor 74.5% |
| Chickasaw | 10.3 /100 | #221 | Poor 74.5% |
| Immigrants | India | 9.9 /100 | #222 | Tragic 74.4% |
| Hispanics or Latinos | 7.9 /100 | #223 | Tragic 74.4% |
| Seminole | 6.9 /100 | #224 | Tragic 74.3% |
| Ghanaians | 6.2 /100 | #225 | Tragic 74.3% |
| Immigrants | Fiji | 5.9 /100 | #226 | Tragic 74.3% |