Cherokee vs Nepalese College, 1 year or more
COMPARE
Cherokee
Nepalese
College, 1 year or more
College, 1 year or more Comparison
Cherokee
Nepalese
53.2%
COLLEGE, 1 YEAR OR MORE
0.0/ 100
METRIC RATING
294th/ 347
METRIC RANK
54.9%
COLLEGE, 1 YEAR OR MORE
0.3/ 100
METRIC RATING
259th/ 347
METRIC RANK
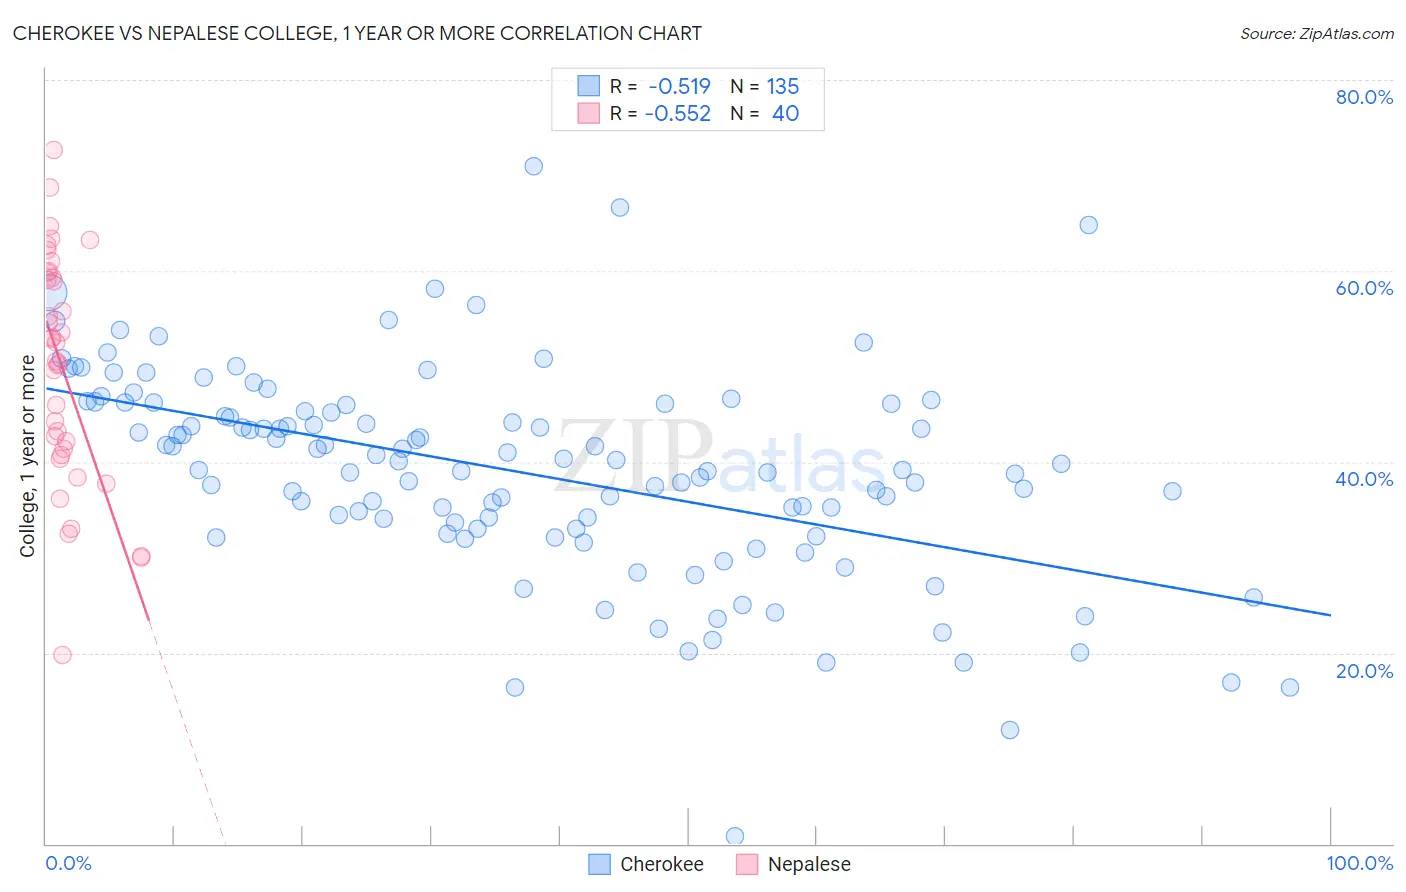
Cherokee vs Nepalese College, 1 year or more Correlation Chart
The statistical analysis conducted on geographies consisting of 493,716,621 people shows a substantial negative correlation between the proportion of Cherokee and percentage of population with at least college, 1 year or more education in the United States with a correlation coefficient (R) of -0.519 and weighted average of 53.2%. Similarly, the statistical analysis conducted on geographies consisting of 24,521,755 people shows a substantial negative correlation between the proportion of Nepalese and percentage of population with at least college, 1 year or more education in the United States with a correlation coefficient (R) of -0.552 and weighted average of 54.9%, a difference of 3.3%.
College, 1 year or more Correlation Summary
| Measurement | Cherokee | Nepalese |
| Minimum | 0.80% | 19.8% |
| Maximum | 70.9% | 72.6% |
| Range | 70.1% | 52.8% |
| Mean | 39.0% | 49.8% |
| Median | 39.7% | 51.5% |
| Interquartile 25% (IQ1) | 33.0% | 41.1% |
| Interquartile 75% (IQ3) | 46.0% | 59.5% |
| Interquartile Range (IQR) | 13.1% | 18.5% |
| Standard Deviation (Sample) | 10.9% | 12.1% |
| Standard Deviation (Population) | 10.9% | 11.9% |
Similar Demographics by College, 1 year or more
Demographics Similar to Cherokee by College, 1 year or more
In terms of college, 1 year or more, the demographic groups most similar to Cherokee are Yaqui (53.2%, a difference of 0.010%), Black/African American (53.3%, a difference of 0.21%), Chickasaw (53.3%, a difference of 0.23%), Sioux (53.0%, a difference of 0.35%), and Cuban (53.4%, a difference of 0.36%).
| Demographics | Rating | Rank | College, 1 year or more |
| Immigrants | Belize | 0.1 /100 | #287 | Tragic 53.5% |
| Alaska Natives | 0.0 /100 | #288 | Tragic 53.4% |
| Immigrants | Ecuador | 0.0 /100 | #289 | Tragic 53.4% |
| Alaskan Athabascans | 0.0 /100 | #290 | Tragic 53.4% |
| Cubans | 0.0 /100 | #291 | Tragic 53.4% |
| Chickasaw | 0.0 /100 | #292 | Tragic 53.3% |
| Blacks/African Americans | 0.0 /100 | #293 | Tragic 53.3% |
| Cherokee | 0.0 /100 | #294 | Tragic 53.2% |
| Yaqui | 0.0 /100 | #295 | Tragic 53.2% |
| Sioux | 0.0 /100 | #296 | Tragic 53.0% |
| Paiute | 0.0 /100 | #297 | Tragic 52.9% |
| Immigrants | Dominica | 0.0 /100 | #298 | Tragic 52.5% |
| Immigrants | Nicaragua | 0.0 /100 | #299 | Tragic 52.4% |
| Choctaw | 0.0 /100 | #300 | Tragic 52.3% |
| Haitians | 0.0 /100 | #301 | Tragic 52.3% |
Demographics Similar to Nepalese by College, 1 year or more
In terms of college, 1 year or more, the demographic groups most similar to Nepalese are African (55.0%, a difference of 0.060%), Jamaican (54.9%, a difference of 0.10%), Ottawa (54.9%, a difference of 0.13%), Immigrants from St. Vincent and the Grenadines (54.8%, a difference of 0.21%), and U.S. Virgin Islander (54.8%, a difference of 0.24%).
| Demographics | Rating | Rank | College, 1 year or more |
| Aleuts | 0.6 /100 | #252 | Tragic 55.4% |
| Immigrants | Barbados | 0.6 /100 | #253 | Tragic 55.4% |
| Japanese | 0.5 /100 | #254 | Tragic 55.2% |
| Immigrants | Bahamas | 0.5 /100 | #255 | Tragic 55.2% |
| Immigrants | West Indies | 0.5 /100 | #256 | Tragic 55.2% |
| Indonesians | 0.4 /100 | #257 | Tragic 55.1% |
| Africans | 0.4 /100 | #258 | Tragic 55.0% |
| Nepalese | 0.3 /100 | #259 | Tragic 54.9% |
| Jamaicans | 0.3 /100 | #260 | Tragic 54.9% |
| Ottawa | 0.3 /100 | #261 | Tragic 54.9% |
| Immigrants | St. Vincent and the Grenadines | 0.3 /100 | #262 | Tragic 54.8% |
| U.S. Virgin Islanders | 0.3 /100 | #263 | Tragic 54.8% |
| Immigrants | Micronesia | 0.3 /100 | #264 | Tragic 54.8% |
| Immigrants | Laos | 0.2 /100 | #265 | Tragic 54.7% |
| Potawatomi | 0.2 /100 | #266 | Tragic 54.6% |