Immigrants from Russia vs Immigrants from Kuwait 8th Grade
COMPARE
Immigrants from Russia
Immigrants from Kuwait
8th Grade
8th Grade Comparison
Immigrants from Russia
Immigrants from Kuwait
96.0%
8TH GRADE
80.9/ 100
METRIC RATING
150th/ 347
METRIC RANK
96.1%
8TH GRADE
92.2/ 100
METRIC RATING
132nd/ 347
METRIC RANK
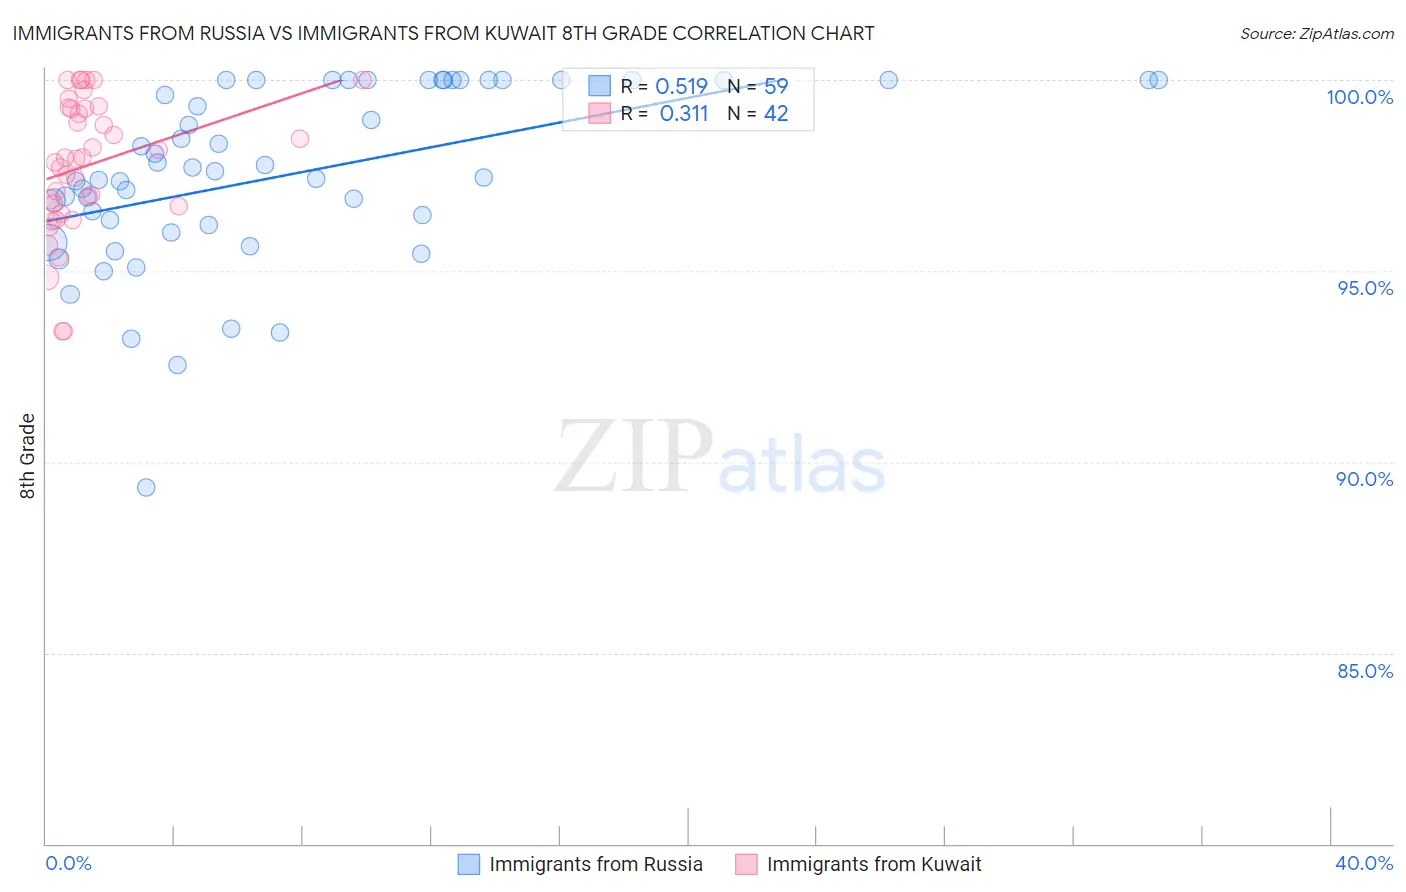
Immigrants from Russia vs Immigrants from Kuwait 8th Grade Correlation Chart
The statistical analysis conducted on geographies consisting of 347,948,494 people shows a substantial positive correlation between the proportion of Immigrants from Russia and percentage of population with at least 8th grade education in the United States with a correlation coefficient (R) of 0.519 and weighted average of 96.0%. Similarly, the statistical analysis conducted on geographies consisting of 136,913,666 people shows a mild positive correlation between the proportion of Immigrants from Kuwait and percentage of population with at least 8th grade education in the United States with a correlation coefficient (R) of 0.311 and weighted average of 96.1%, a difference of 0.17%.
8th Grade Correlation Summary
| Measurement | Immigrants from Russia | Immigrants from Kuwait |
| Minimum | 89.3% | 93.4% |
| Maximum | 100.0% | 100.0% |
| Range | 10.7% | 6.6% |
| Mean | 97.5% | 97.8% |
| Median | 97.6% | 98.0% |
| Interquartile 25% (IQ1) | 96.2% | 96.7% |
| Interquartile 75% (IQ3) | 100.0% | 99.2% |
| Interquartile Range (IQR) | 3.8% | 2.6% |
| Standard Deviation (Sample) | 2.3% | 1.7% |
| Standard Deviation (Population) | 2.3% | 1.7% |
Demographics Similar to Immigrants from Russia and Immigrants from Kuwait by 8th Grade
In terms of 8th grade, the demographic groups most similar to Immigrants from Russia are Immigrants from Israel (96.0%, a difference of 0.0%), Blackfeet (96.0%, a difference of 0.0%), Albanian (96.0%, a difference of 0.020%), Colville (96.0%, a difference of 0.030%), and Lumbee (96.0%, a difference of 0.040%). Similarly, the demographic groups most similar to Immigrants from Kuwait are Pueblo (96.1%, a difference of 0.0%), Immigrants from Turkey (96.1%, a difference of 0.010%), Immigrants from Hungary (96.1%, a difference of 0.010%), Basque (96.1%, a difference of 0.010%), and Jordanian (96.1%, a difference of 0.020%).
| Demographics | Rating | Rank | 8th Grade |
| Pueblo | 92.3 /100 | #131 | Exceptional 96.1% |
| Immigrants | Kuwait | 92.2 /100 | #132 | Exceptional 96.1% |
| Immigrants | Turkey | 91.7 /100 | #133 | Exceptional 96.1% |
| Immigrants | Hungary | 91.5 /100 | #134 | Exceptional 96.1% |
| Basques | 91.5 /100 | #135 | Exceptional 96.1% |
| Jordanians | 91.3 /100 | #136 | Exceptional 96.1% |
| Cambodians | 90.6 /100 | #137 | Exceptional 96.1% |
| Burmese | 90.2 /100 | #138 | Exceptional 96.1% |
| Hmong | 89.7 /100 | #139 | Excellent 96.1% |
| Immigrants | South Central Asia | 89.4 /100 | #140 | Excellent 96.1% |
| Immigrants | Greece | 85.9 /100 | #141 | Excellent 96.0% |
| Immigrants | Eastern Europe | 85.4 /100 | #142 | Excellent 96.0% |
| Spanish | 85.1 /100 | #143 | Excellent 96.0% |
| Immigrants | Belarus | 84.8 /100 | #144 | Excellent 96.0% |
| Lumbee | 84.1 /100 | #145 | Excellent 96.0% |
| Israelis | 84.1 /100 | #146 | Excellent 96.0% |
| Colville | 84.0 /100 | #147 | Excellent 96.0% |
| Albanians | 83.1 /100 | #148 | Excellent 96.0% |
| Immigrants | Israel | 81.3 /100 | #149 | Excellent 96.0% |
| Immigrants | Russia | 80.9 /100 | #150 | Excellent 96.0% |
| Blackfeet | 80.8 /100 | #151 | Excellent 96.0% |