Immigrants from Romania vs Lumbee Professional Degree
COMPARE
Immigrants from Romania
Lumbee
Professional Degree
Professional Degree Comparison
Immigrants from Romania
Lumbee
5.4%
PROFESSIONAL DEGREE
99.8/ 100
METRIC RATING
73rd/ 347
METRIC RANK
2.5%
PROFESSIONAL DEGREE
0.0/ 100
METRIC RATING
346th/ 347
METRIC RANK
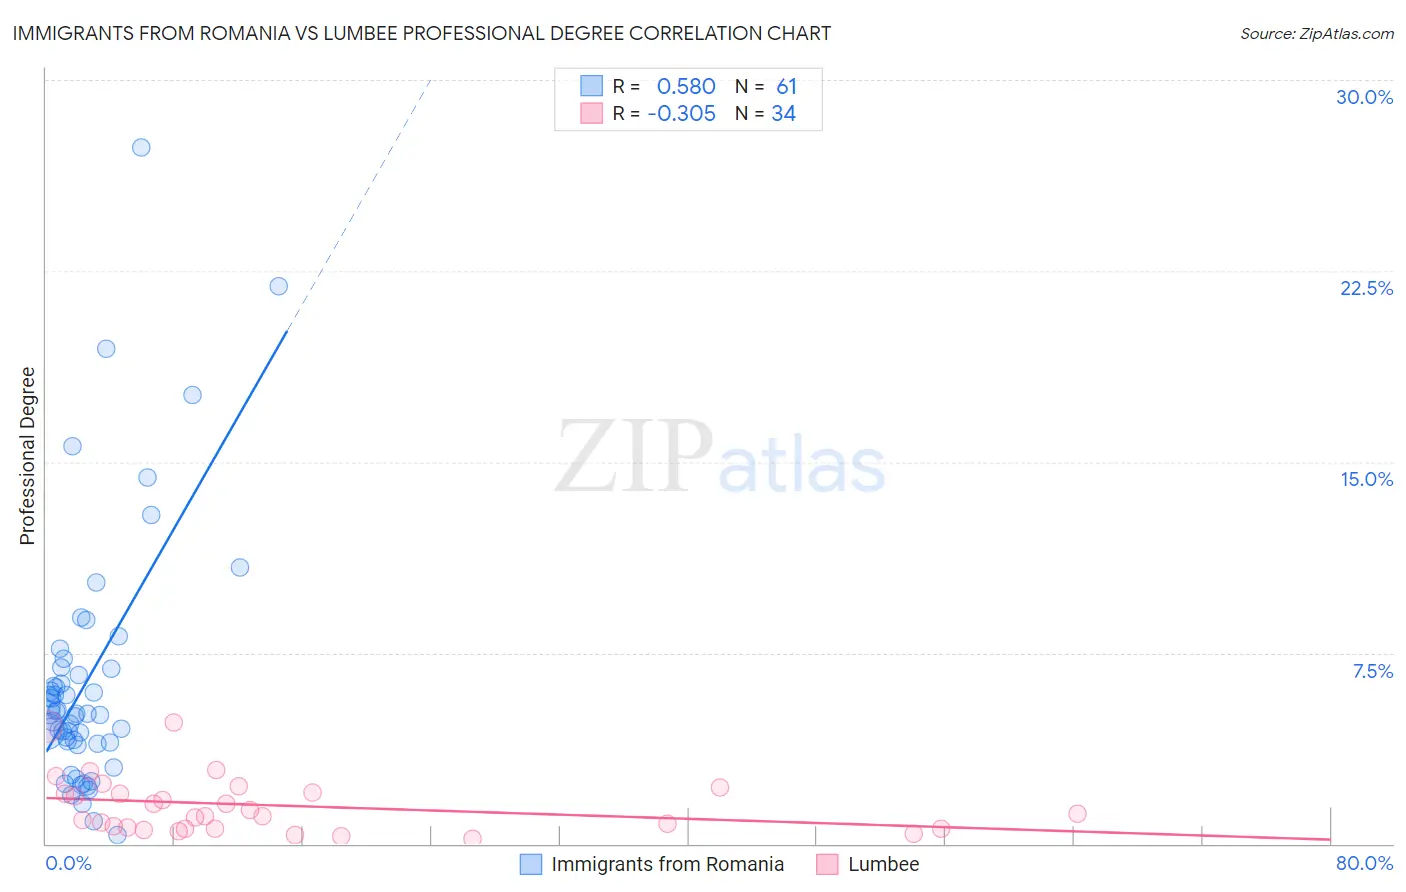
Immigrants from Romania vs Lumbee Professional Degree Correlation Chart
The statistical analysis conducted on geographies consisting of 256,846,441 people shows a substantial positive correlation between the proportion of Immigrants from Romania and percentage of population with at least professional degree education in the United States with a correlation coefficient (R) of 0.580 and weighted average of 5.4%. Similarly, the statistical analysis conducted on geographies consisting of 92,157,121 people shows a mild negative correlation between the proportion of Lumbee and percentage of population with at least professional degree education in the United States with a correlation coefficient (R) of -0.305 and weighted average of 2.5%, a difference of 118.3%.
Professional Degree Correlation Summary
| Measurement | Immigrants from Romania | Lumbee |
| Minimum | 0.34% | 0.22% |
| Maximum | 27.4% | 4.8% |
| Range | 27.0% | 4.6% |
| Mean | 6.5% | 1.5% |
| Median | 5.1% | 1.1% |
| Interquartile 25% (IQ1) | 4.0% | 0.60% |
| Interquartile 75% (IQ3) | 6.9% | 2.0% |
| Interquartile Range (IQR) | 2.9% | 1.4% |
| Standard Deviation (Sample) | 5.1% | 1.1% |
| Standard Deviation (Population) | 5.0% | 1.1% |
Similar Demographics by Professional Degree
Demographics Similar to Immigrants from Romania by Professional Degree
In terms of professional degree, the demographic groups most similar to Immigrants from Romania are Lithuanian (5.4%, a difference of 0.10%), Ethiopian (5.4%, a difference of 0.38%), Immigrants from Indonesia (5.3%, a difference of 0.51%), Immigrants from Western Asia (5.4%, a difference of 0.58%), and Immigrants from Canada (5.3%, a difference of 0.60%).
| Demographics | Rating | Rank | Professional Degree |
| Immigrants | Kazakhstan | 99.9 /100 | #66 | Exceptional 5.5% |
| Immigrants | Bulgaria | 99.9 /100 | #67 | Exceptional 5.5% |
| Immigrants | Lebanon | 99.9 /100 | #68 | Exceptional 5.5% |
| Immigrants | Hungary | 99.9 /100 | #69 | Exceptional 5.5% |
| Bhutanese | 99.8 /100 | #70 | Exceptional 5.4% |
| Immigrants | Western Asia | 99.8 /100 | #71 | Exceptional 5.4% |
| Lithuanians | 99.8 /100 | #72 | Exceptional 5.4% |
| Immigrants | Romania | 99.8 /100 | #73 | Exceptional 5.4% |
| Ethiopians | 99.7 /100 | #74 | Exceptional 5.4% |
| Immigrants | Indonesia | 99.7 /100 | #75 | Exceptional 5.3% |
| Immigrants | Canada | 99.7 /100 | #76 | Exceptional 5.3% |
| Immigrants | Ethiopia | 99.7 /100 | #77 | Exceptional 5.3% |
| Armenians | 99.7 /100 | #78 | Exceptional 5.3% |
| Immigrants | North America | 99.7 /100 | #79 | Exceptional 5.3% |
| Immigrants | England | 99.6 /100 | #80 | Exceptional 5.3% |
Demographics Similar to Lumbee by Professional Degree
In terms of professional degree, the demographic groups most similar to Lumbee are Immigrants from Mexico (2.6%, a difference of 7.4%), Spanish American Indian (2.7%, a difference of 7.7%), Houma (2.2%, a difference of 11.1%), Mexican (2.7%, a difference of 11.7%), and Immigrants from the Azores (2.8%, a difference of 14.8%).
| Demographics | Rating | Rank | Professional Degree |
| Puget Sound Salish | 0.0 /100 | #333 | Tragic 3.1% |
| Pennsylvania Germans | 0.0 /100 | #334 | Tragic 3.0% |
| Natives/Alaskans | 0.0 /100 | #335 | Tragic 3.0% |
| Fijians | 0.0 /100 | #336 | Tragic 2.9% |
| Arapaho | 0.0 /100 | #337 | Tragic 2.9% |
| Navajo | 0.0 /100 | #338 | Tragic 2.9% |
| Immigrants | Central America | 0.0 /100 | #339 | Tragic 2.9% |
| Yup'ik | 0.0 /100 | #340 | Tragic 2.9% |
| Tohono O'odham | 0.0 /100 | #341 | Tragic 2.8% |
| Immigrants | Azores | 0.0 /100 | #342 | Tragic 2.8% |
| Mexicans | 0.0 /100 | #343 | Tragic 2.7% |
| Spanish American Indians | 0.0 /100 | #344 | Tragic 2.7% |
| Immigrants | Mexico | 0.0 /100 | #345 | Tragic 2.6% |
| Lumbee | 0.0 /100 | #346 | Tragic 2.5% |
| Houma | 0.0 /100 | #347 | Tragic 2.2% |