Immigrants from Portugal vs Paraguayan Master's Degree
COMPARE
Immigrants from Portugal
Paraguayan
Master's Degree
Master's Degree Comparison
Immigrants from Portugal
Paraguayans
12.6%
MASTER'S DEGREE
0.8/ 100
METRIC RATING
256th/ 347
METRIC RANK
18.8%
MASTER'S DEGREE
100.0/ 100
METRIC RATING
48th/ 347
METRIC RANK
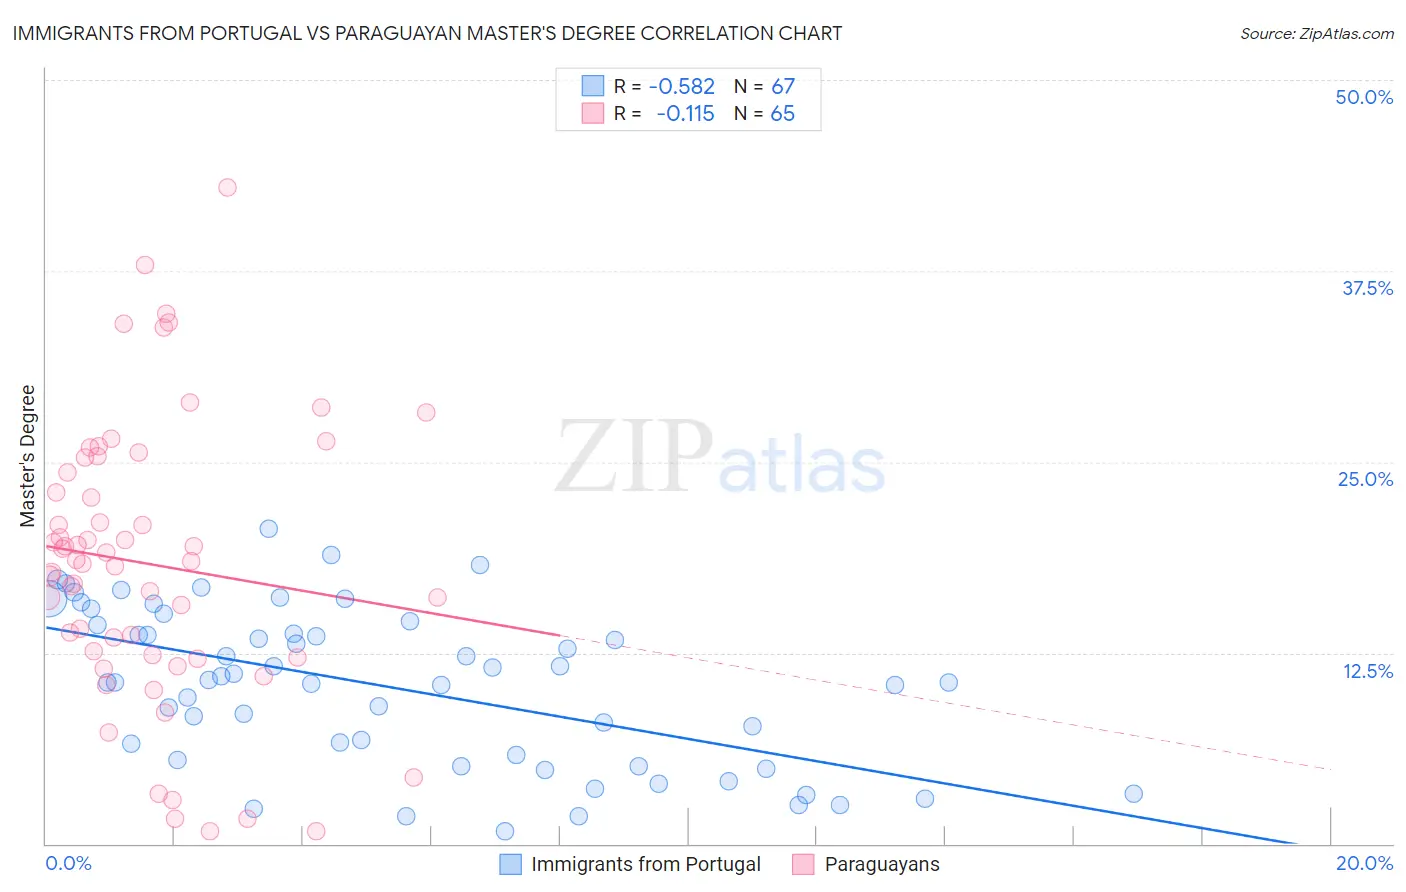
Immigrants from Portugal vs Paraguayan Master's Degree Correlation Chart
The statistical analysis conducted on geographies consisting of 174,778,978 people shows a substantial negative correlation between the proportion of Immigrants from Portugal and percentage of population with at least master's degree education in the United States with a correlation coefficient (R) of -0.582 and weighted average of 12.6%. Similarly, the statistical analysis conducted on geographies consisting of 95,082,006 people shows a poor negative correlation between the proportion of Paraguayans and percentage of population with at least master's degree education in the United States with a correlation coefficient (R) of -0.115 and weighted average of 18.8%, a difference of 48.9%.
Master's Degree Correlation Summary
| Measurement | Immigrants from Portugal | Paraguayan |
| Minimum | 0.81% | 0.82% |
| Maximum | 20.6% | 42.9% |
| Range | 19.8% | 42.1% |
| Mean | 10.3% | 18.3% |
| Median | 10.6% | 18.5% |
| Interquartile 25% (IQ1) | 5.5% | 12.3% |
| Interquartile 75% (IQ3) | 14.3% | 24.8% |
| Interquartile Range (IQR) | 8.8% | 12.5% |
| Standard Deviation (Sample) | 5.1% | 9.2% |
| Standard Deviation (Population) | 5.1% | 9.1% |
Similar Demographics by Master's Degree
Demographics Similar to Immigrants from Portugal by Master's Degree
In terms of master's degree, the demographic groups most similar to Immigrants from Portugal are Immigrants from Congo (12.6%, a difference of 0.080%), Indonesian (12.6%, a difference of 0.10%), Immigrants from Dominica (12.6%, a difference of 0.14%), Osage (12.6%, a difference of 0.48%), and French American Indian (12.7%, a difference of 0.69%).
| Demographics | Rating | Rank | Master's Degree |
| Cree | 1.3 /100 | #249 | Tragic 12.8% |
| Liberians | 1.3 /100 | #250 | Tragic 12.8% |
| Tlingit-Haida | 1.3 /100 | #251 | Tragic 12.8% |
| French American Indians | 1.0 /100 | #252 | Tragic 12.7% |
| Immigrants | Dominica | 0.8 /100 | #253 | Tragic 12.6% |
| Indonesians | 0.8 /100 | #254 | Tragic 12.6% |
| Immigrants | Congo | 0.8 /100 | #255 | Tragic 12.6% |
| Immigrants | Portugal | 0.8 /100 | #256 | Tragic 12.6% |
| Osage | 0.7 /100 | #257 | Tragic 12.6% |
| Immigrants | Liberia | 0.6 /100 | #258 | Tragic 12.5% |
| Japanese | 0.6 /100 | #259 | Tragic 12.5% |
| Dominicans | 0.6 /100 | #260 | Tragic 12.5% |
| Tongans | 0.6 /100 | #261 | Tragic 12.5% |
| Nicaraguans | 0.6 /100 | #262 | Tragic 12.5% |
| Central American Indians | 0.5 /100 | #263 | Tragic 12.4% |
Demographics Similar to Paraguayans by Master's Degree
In terms of master's degree, the demographic groups most similar to Paraguayans are Immigrants from Austria (18.8%, a difference of 0.060%), Immigrants from Norway (18.8%, a difference of 0.070%), Estonian (18.8%, a difference of 0.10%), Bulgarian (18.8%, a difference of 0.28%), and Immigrants from South Africa (18.8%, a difference of 0.30%).
| Demographics | Rating | Rank | Master's Degree |
| Immigrants | Latvia | 100.0 /100 | #41 | Exceptional 19.1% |
| Immigrants | Saudi Arabia | 100.0 /100 | #42 | Exceptional 19.0% |
| Immigrants | Greece | 100.0 /100 | #43 | Exceptional 19.0% |
| Immigrants | Malaysia | 100.0 /100 | #44 | Exceptional 18.9% |
| Immigrants | Belarus | 100.0 /100 | #45 | Exceptional 18.9% |
| Immigrants | Norway | 100.0 /100 | #46 | Exceptional 18.8% |
| Immigrants | Austria | 100.0 /100 | #47 | Exceptional 18.8% |
| Paraguayans | 100.0 /100 | #48 | Exceptional 18.8% |
| Estonians | 100.0 /100 | #49 | Exceptional 18.8% |
| Bulgarians | 100.0 /100 | #50 | Exceptional 18.8% |
| Immigrants | South Africa | 100.0 /100 | #51 | Exceptional 18.8% |
| Immigrants | Kuwait | 100.0 /100 | #52 | Exceptional 18.6% |
| Immigrants | Czechoslovakia | 99.9 /100 | #53 | Exceptional 18.5% |
| Immigrants | Lithuania | 99.9 /100 | #54 | Exceptional 18.5% |
| Immigrants | Serbia | 99.9 /100 | #55 | Exceptional 18.5% |