Immigrants from Peru vs Trinidadian and Tobagonian Disability Age Over 75
COMPARE
Immigrants from Peru
Trinidadian and Tobagonian
Disability Age Over 75
Disability Age Over 75 Comparison
Immigrants from Peru
Trinidadians and Tobagonians
46.9%
DISABILITY AGE OVER 75
84.1/ 100
METRIC RATING
147th/ 347
METRIC RANK
47.7%
DISABILITY AGE OVER 75
20.0/ 100
METRIC RATING
203rd/ 347
METRIC RANK
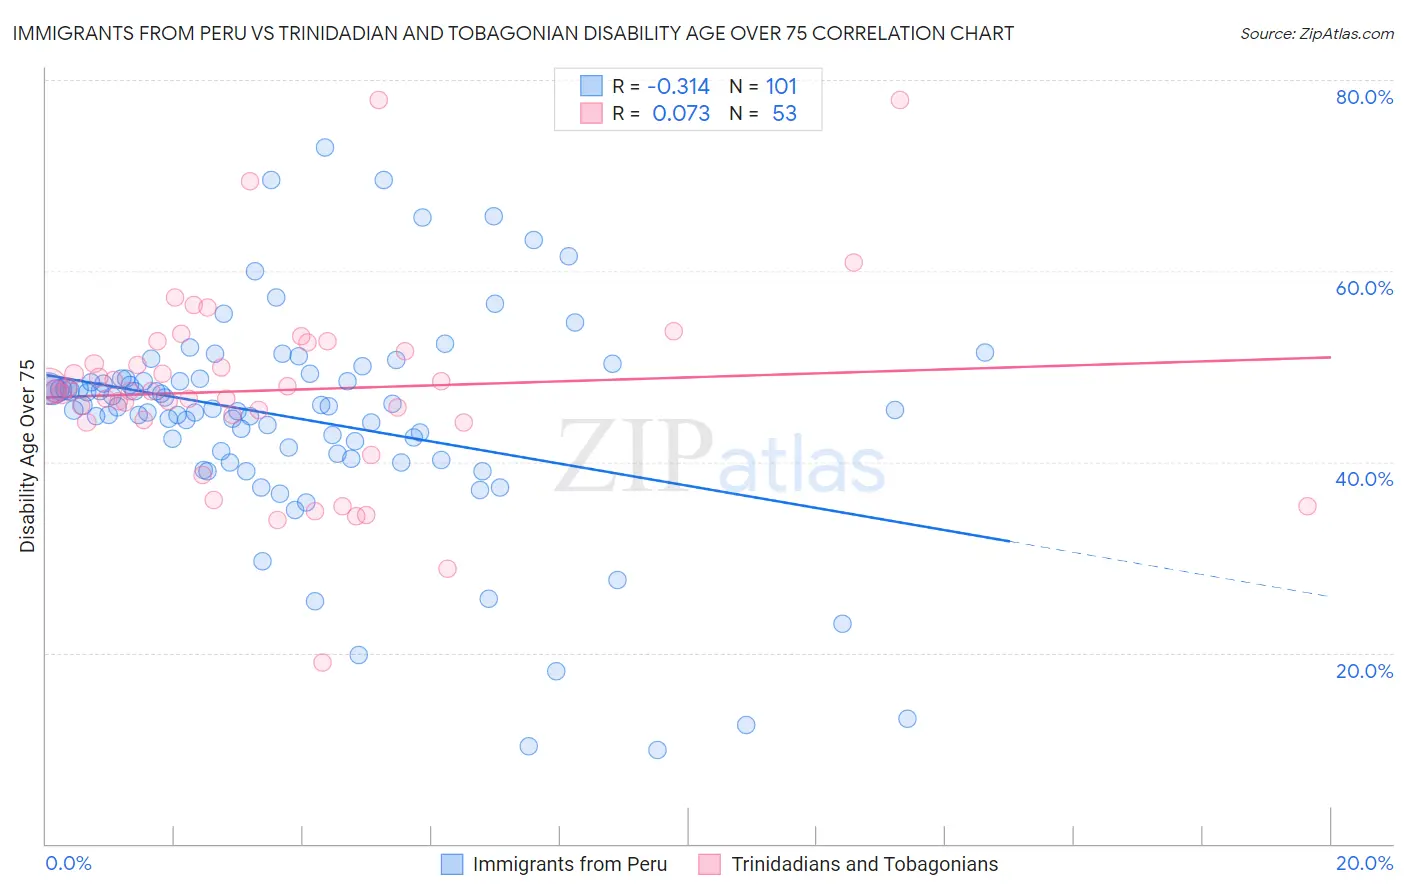
Immigrants from Peru vs Trinidadian and Tobagonian Disability Age Over 75 Correlation Chart
The statistical analysis conducted on geographies consisting of 328,503,391 people shows a mild negative correlation between the proportion of Immigrants from Peru and percentage of population with a disability over the age of 75 in the United States with a correlation coefficient (R) of -0.314 and weighted average of 46.9%. Similarly, the statistical analysis conducted on geographies consisting of 219,483,630 people shows a slight positive correlation between the proportion of Trinidadians and Tobagonians and percentage of population with a disability over the age of 75 in the United States with a correlation coefficient (R) of 0.073 and weighted average of 47.7%, a difference of 1.7%.
Disability Age Over 75 Correlation Summary
| Measurement | Immigrants from Peru | Trinidadian and Tobagonian |
| Minimum | 9.9% | 18.9% |
| Maximum | 73.0% | 77.9% |
| Range | 63.1% | 59.0% |
| Mean | 44.5% | 47.5% |
| Median | 45.8% | 47.4% |
| Interquartile 25% (IQ1) | 40.6% | 44.3% |
| Interquartile 75% (IQ3) | 48.7% | 52.0% |
| Interquartile Range (IQR) | 8.1% | 7.7% |
| Standard Deviation (Sample) | 11.5% | 10.2% |
| Standard Deviation (Population) | 11.4% | 10.1% |
Similar Demographics by Disability Age Over 75
Demographics Similar to Immigrants from Peru by Disability Age Over 75
In terms of disability age over 75, the demographic groups most similar to Immigrants from Peru are Guyanese (46.9%, a difference of 0.010%), Costa Rican (46.9%, a difference of 0.020%), Venezuelan (46.9%, a difference of 0.040%), Bermudan (46.9%, a difference of 0.070%), and Asian (46.9%, a difference of 0.10%).
| Demographics | Rating | Rank | Disability Age Over 75 |
| Immigrants | Costa Rica | 87.4 /100 | #140 | Excellent 46.8% |
| Lebanese | 87.0 /100 | #141 | Excellent 46.8% |
| Peruvians | 86.5 /100 | #142 | Excellent 46.8% |
| Bermudans | 85.6 /100 | #143 | Excellent 46.9% |
| Venezuelans | 85.0 /100 | #144 | Excellent 46.9% |
| Costa Ricans | 84.5 /100 | #145 | Excellent 46.9% |
| Guyanese | 84.3 /100 | #146 | Excellent 46.9% |
| Immigrants | Peru | 84.1 /100 | #147 | Excellent 46.9% |
| Asians | 81.6 /100 | #148 | Excellent 46.9% |
| Welsh | 81.3 /100 | #149 | Excellent 47.0% |
| Immigrants | Russia | 79.3 /100 | #150 | Good 47.0% |
| French Canadians | 79.0 /100 | #151 | Good 47.0% |
| Immigrants | Asia | 76.5 /100 | #152 | Good 47.0% |
| Immigrants | Zaire | 74.8 /100 | #153 | Good 47.1% |
| Immigrants | Belarus | 74.8 /100 | #154 | Good 47.1% |
Demographics Similar to Trinidadians and Tobagonians by Disability Age Over 75
In terms of disability age over 75, the demographic groups most similar to Trinidadians and Tobagonians are Immigrants from Bahamas (47.7%, a difference of 0.020%), Immigrants from Cuba (47.7%, a difference of 0.030%), Nigerian (47.7%, a difference of 0.030%), Immigrants from Ghana (47.7%, a difference of 0.030%), and Jamaican (47.7%, a difference of 0.040%).
| Demographics | Rating | Rank | Disability Age Over 75 |
| Immigrants | Portugal | 23.8 /100 | #196 | Fair 47.6% |
| Pakistanis | 23.4 /100 | #197 | Fair 47.7% |
| Immigrants | Ukraine | 23.2 /100 | #198 | Fair 47.7% |
| Immigrants | Eritrea | 22.4 /100 | #199 | Fair 47.7% |
| Immigrants | Somalia | 21.4 /100 | #200 | Fair 47.7% |
| Immigrants | Cuba | 20.9 /100 | #201 | Fair 47.7% |
| Immigrants | Bahamas | 20.7 /100 | #202 | Fair 47.7% |
| Trinidadians and Tobagonians | 20.0 /100 | #203 | Fair 47.7% |
| Nigerians | 19.2 /100 | #204 | Poor 47.7% |
| Immigrants | Ghana | 19.1 /100 | #205 | Poor 47.7% |
| Jamaicans | 19.0 /100 | #206 | Poor 47.7% |
| Immigrants | Syria | 17.4 /100 | #207 | Poor 47.8% |
| Immigrants | Senegal | 16.9 /100 | #208 | Poor 47.8% |
| Immigrants | Indonesia | 14.2 /100 | #209 | Poor 47.8% |
| Vietnamese | 11.9 /100 | #210 | Poor 47.9% |