Immigrants from Peru vs Immigrants from Ethiopia 10th Grade
COMPARE
Immigrants from Peru
Immigrants from Ethiopia
10th Grade
10th Grade Comparison
Immigrants from Peru
Immigrants from Ethiopia
92.2%
10TH GRADE
0.1/ 100
METRIC RATING
282nd/ 347
METRIC RANK
93.1%
10TH GRADE
5.1/ 100
METRIC RATING
229th/ 347
METRIC RANK
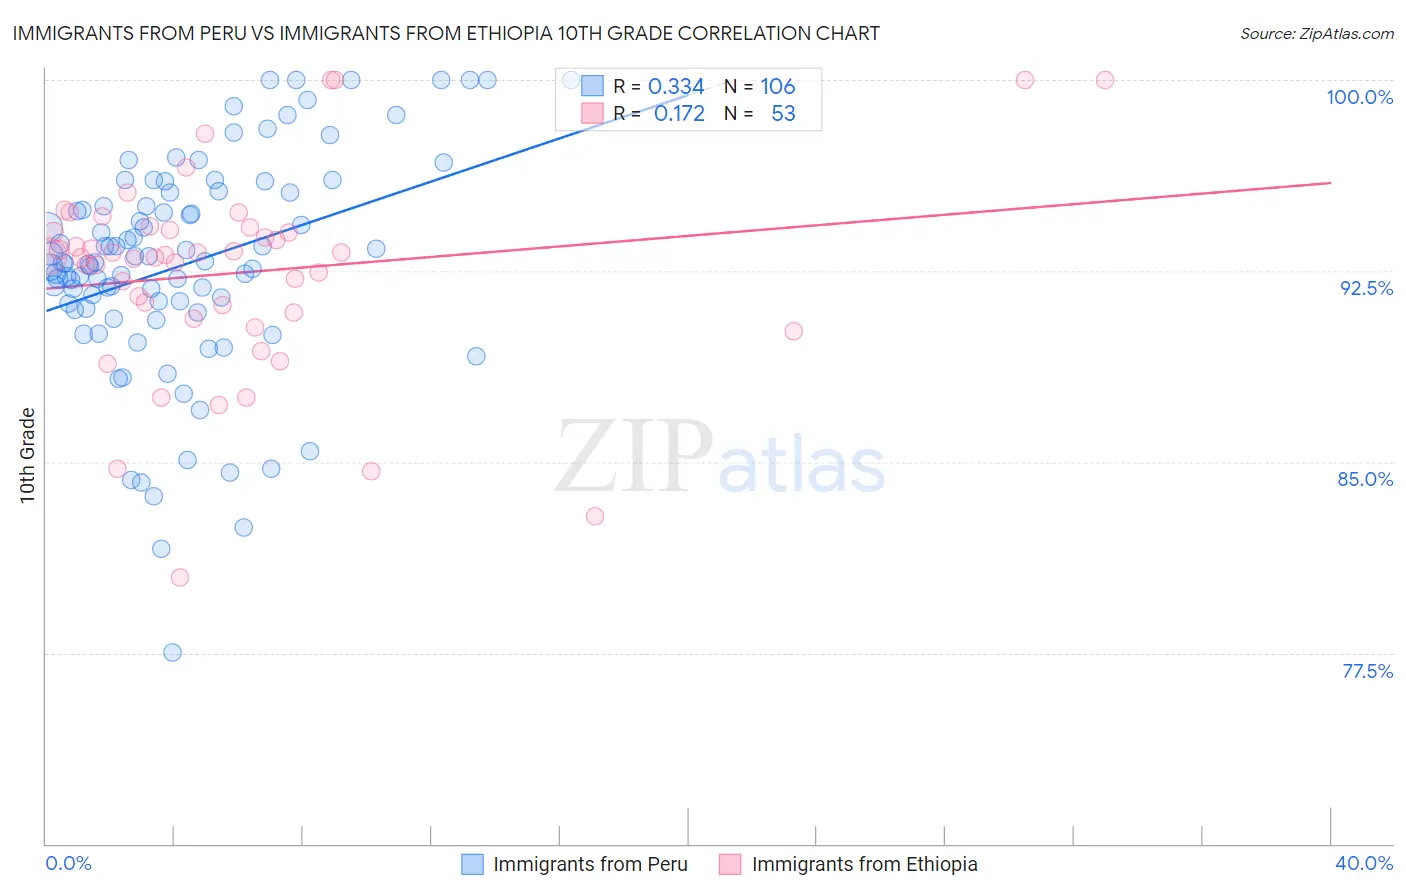
Immigrants from Peru vs Immigrants from Ethiopia 10th Grade Correlation Chart
The statistical analysis conducted on geographies consisting of 328,860,880 people shows a mild positive correlation between the proportion of Immigrants from Peru and percentage of population with at least 10th grade education in the United States with a correlation coefficient (R) of 0.334 and weighted average of 92.2%. Similarly, the statistical analysis conducted on geographies consisting of 211,528,629 people shows a poor positive correlation between the proportion of Immigrants from Ethiopia and percentage of population with at least 10th grade education in the United States with a correlation coefficient (R) of 0.172 and weighted average of 93.1%, a difference of 1.0%.
10th Grade Correlation Summary
| Measurement | Immigrants from Peru | Immigrants from Ethiopia |
| Minimum | 77.5% | 80.4% |
| Maximum | 100.0% | 100.0% |
| Range | 22.5% | 19.6% |
| Mean | 92.8% | 92.4% |
| Median | 92.8% | 93.1% |
| Interquartile 25% (IQ1) | 91.0% | 90.7% |
| Interquartile 75% (IQ3) | 95.6% | 94.2% |
| Interquartile Range (IQR) | 4.6% | 3.4% |
| Standard Deviation (Sample) | 4.3% | 4.0% |
| Standard Deviation (Population) | 4.3% | 3.9% |
Similar Demographics by 10th Grade
Demographics Similar to Immigrants from Peru by 10th Grade
In terms of 10th grade, the demographic groups most similar to Immigrants from Peru are Bangladeshi (92.2%, a difference of 0.020%), Malaysian (92.2%, a difference of 0.030%), Barbadian (92.2%, a difference of 0.060%), Native/Alaskan (92.2%, a difference of 0.060%), and Immigrants from St. Vincent and the Grenadines (92.1%, a difference of 0.060%).
| Demographics | Rating | Rank | 10th Grade |
| West Indians | 0.2 /100 | #275 | Tragic 92.4% |
| Immigrants | Trinidad and Tobago | 0.1 /100 | #276 | Tragic 92.3% |
| Navajo | 0.1 /100 | #277 | Tragic 92.3% |
| Barbadians | 0.1 /100 | #278 | Tragic 92.2% |
| Natives/Alaskans | 0.1 /100 | #279 | Tragic 92.2% |
| Malaysians | 0.1 /100 | #280 | Tragic 92.2% |
| Bangladeshis | 0.1 /100 | #281 | Tragic 92.2% |
| Immigrants | Peru | 0.1 /100 | #282 | Tragic 92.2% |
| Immigrants | St. Vincent and the Grenadines | 0.0 /100 | #283 | Tragic 92.1% |
| Immigrants | Barbados | 0.0 /100 | #284 | Tragic 92.1% |
| Immigrants | South Eastern Asia | 0.0 /100 | #285 | Tragic 92.1% |
| Yuman | 0.0 /100 | #286 | Tragic 92.0% |
| Pennsylvania Germans | 0.0 /100 | #287 | Tragic 91.9% |
| Immigrants | Laos | 0.0 /100 | #288 | Tragic 91.9% |
| Sri Lankans | 0.0 /100 | #289 | Tragic 91.8% |
Demographics Similar to Immigrants from Ethiopia by 10th Grade
In terms of 10th grade, the demographic groups most similar to Immigrants from Ethiopia are Immigrants from Africa (93.1%, a difference of 0.0%), South American Indian (93.1%, a difference of 0.010%), Bahamian (93.1%, a difference of 0.010%), Comanche (93.1%, a difference of 0.010%), and Subsaharan African (93.1%, a difference of 0.020%).
| Demographics | Rating | Rank | 10th Grade |
| Ethiopians | 7.9 /100 | #222 | Tragic 93.2% |
| Immigrants | Sierra Leone | 7.6 /100 | #223 | Tragic 93.2% |
| Bolivians | 6.7 /100 | #224 | Tragic 93.2% |
| Somalis | 6.2 /100 | #225 | Tragic 93.2% |
| Koreans | 6.1 /100 | #226 | Tragic 93.2% |
| Blacks/African Americans | 6.0 /100 | #227 | Tragic 93.2% |
| Immigrants | China | 5.9 /100 | #228 | Tragic 93.2% |
| Immigrants | Ethiopia | 5.1 /100 | #229 | Tragic 93.1% |
| Immigrants | Africa | 5.0 /100 | #230 | Tragic 93.1% |
| South American Indians | 4.9 /100 | #231 | Tragic 93.1% |
| Bahamians | 4.9 /100 | #232 | Tragic 93.1% |
| Comanche | 4.9 /100 | #233 | Tragic 93.1% |
| Sub-Saharan Africans | 4.7 /100 | #234 | Tragic 93.1% |
| Africans | 4.6 /100 | #235 | Tragic 93.1% |
| Afghans | 4.5 /100 | #236 | Tragic 93.1% |