Immigrants from Peru vs Immigrants from Central America 10th Grade
COMPARE
Immigrants from Peru
Immigrants from Central America
10th Grade
10th Grade Comparison
Immigrants from Peru
Immigrants from Central America
92.2%
10TH GRADE
0.1/ 100
METRIC RATING
282nd/ 347
METRIC RANK
86.6%
10TH GRADE
0.0/ 100
METRIC RATING
345th/ 347
METRIC RANK
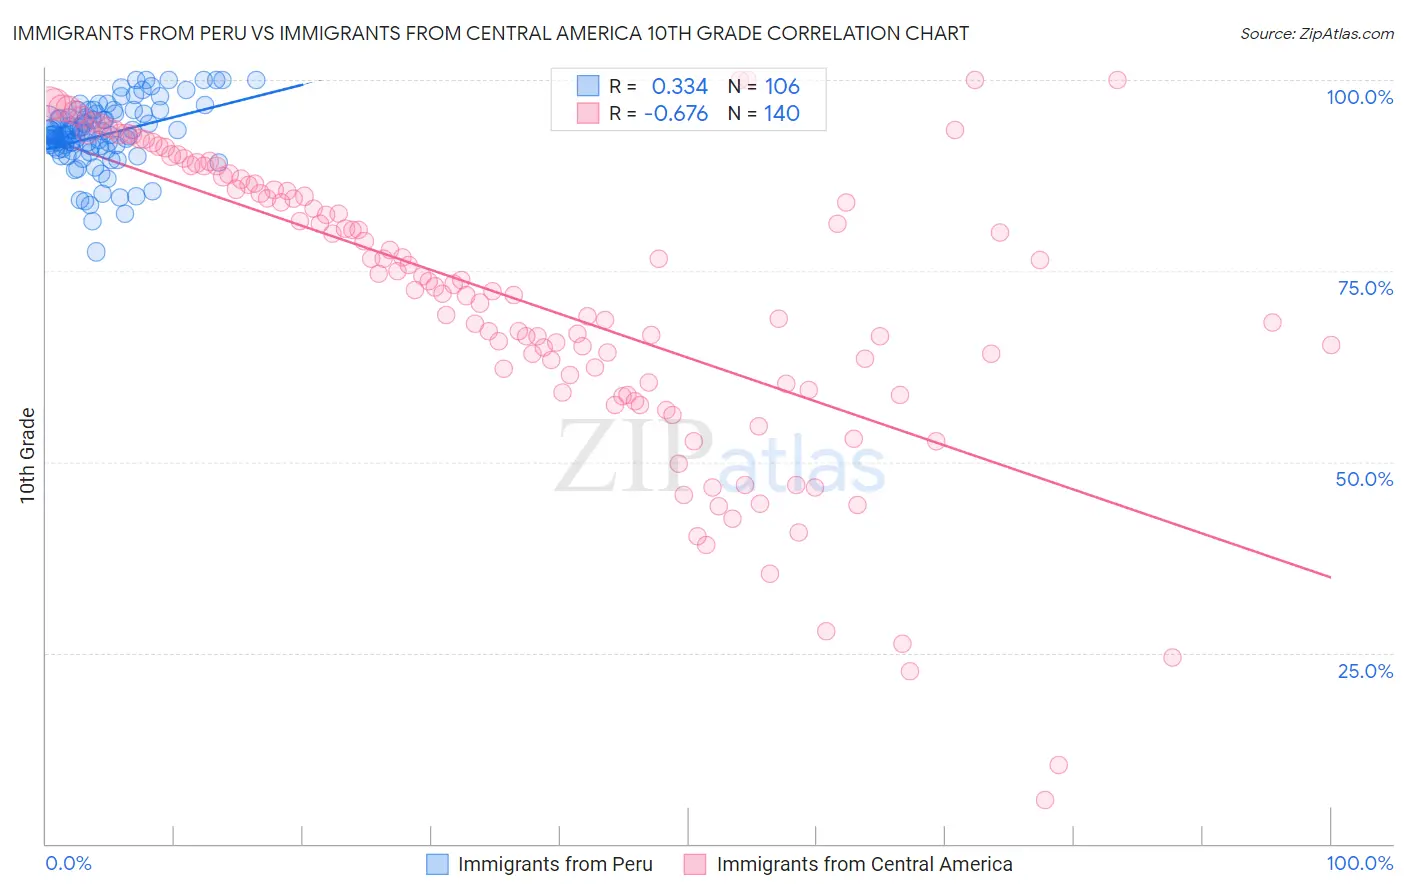
Immigrants from Peru vs Immigrants from Central America 10th Grade Correlation Chart
The statistical analysis conducted on geographies consisting of 328,860,880 people shows a mild positive correlation between the proportion of Immigrants from Peru and percentage of population with at least 10th grade education in the United States with a correlation coefficient (R) of 0.334 and weighted average of 92.2%. Similarly, the statistical analysis conducted on geographies consisting of 536,553,521 people shows a significant negative correlation between the proportion of Immigrants from Central America and percentage of population with at least 10th grade education in the United States with a correlation coefficient (R) of -0.676 and weighted average of 86.6%, a difference of 6.4%.
10th Grade Correlation Summary
| Measurement | Immigrants from Peru | Immigrants from Central America |
| Minimum | 77.5% | 5.7% |
| Maximum | 100.0% | 100.0% |
| Range | 22.5% | 94.3% |
| Mean | 92.8% | 71.5% |
| Median | 92.8% | 73.5% |
| Interquartile 25% (IQ1) | 91.0% | 60.3% |
| Interquartile 75% (IQ3) | 95.6% | 86.7% |
| Interquartile Range (IQR) | 4.6% | 26.4% |
| Standard Deviation (Sample) | 4.3% | 19.3% |
| Standard Deviation (Population) | 4.3% | 19.3% |
Similar Demographics by 10th Grade
Demographics Similar to Immigrants from Peru by 10th Grade
In terms of 10th grade, the demographic groups most similar to Immigrants from Peru are Bangladeshi (92.2%, a difference of 0.020%), Malaysian (92.2%, a difference of 0.030%), Barbadian (92.2%, a difference of 0.060%), Native/Alaskan (92.2%, a difference of 0.060%), and Immigrants from St. Vincent and the Grenadines (92.1%, a difference of 0.060%).
| Demographics | Rating | Rank | 10th Grade |
| West Indians | 0.2 /100 | #275 | Tragic 92.4% |
| Immigrants | Trinidad and Tobago | 0.1 /100 | #276 | Tragic 92.3% |
| Navajo | 0.1 /100 | #277 | Tragic 92.3% |
| Barbadians | 0.1 /100 | #278 | Tragic 92.2% |
| Natives/Alaskans | 0.1 /100 | #279 | Tragic 92.2% |
| Malaysians | 0.1 /100 | #280 | Tragic 92.2% |
| Bangladeshis | 0.1 /100 | #281 | Tragic 92.2% |
| Immigrants | Peru | 0.1 /100 | #282 | Tragic 92.2% |
| Immigrants | St. Vincent and the Grenadines | 0.0 /100 | #283 | Tragic 92.1% |
| Immigrants | Barbados | 0.0 /100 | #284 | Tragic 92.1% |
| Immigrants | South Eastern Asia | 0.0 /100 | #285 | Tragic 92.1% |
| Yuman | 0.0 /100 | #286 | Tragic 92.0% |
| Pennsylvania Germans | 0.0 /100 | #287 | Tragic 91.9% |
| Immigrants | Laos | 0.0 /100 | #288 | Tragic 91.9% |
| Sri Lankans | 0.0 /100 | #289 | Tragic 91.8% |
Demographics Similar to Immigrants from Central America by 10th Grade
In terms of 10th grade, the demographic groups most similar to Immigrants from Central America are Immigrants from El Salvador (86.8%, a difference of 0.18%), Yakama (86.9%, a difference of 0.32%), Spanish American Indian (86.2%, a difference of 0.45%), Immigrants from Mexico (86.2%, a difference of 0.47%), and Immigrants from Guatemala (87.4%, a difference of 0.90%).
| Demographics | Rating | Rank | 10th Grade |
| Hondurans | 0.0 /100 | #333 | Tragic 89.0% |
| Hispanics or Latinos | 0.0 /100 | #334 | Tragic 88.9% |
| Immigrants | Dominican Republic | 0.0 /100 | #335 | Tragic 88.7% |
| Immigrants | Honduras | 0.0 /100 | #336 | Tragic 88.5% |
| Central Americans | 0.0 /100 | #337 | Tragic 88.4% |
| Immigrants | Latin America | 0.0 /100 | #338 | Tragic 88.3% |
| Guatemalans | 0.0 /100 | #339 | Tragic 87.9% |
| Mexicans | 0.0 /100 | #340 | Tragic 87.8% |
| Salvadorans | 0.0 /100 | #341 | Tragic 87.5% |
| Immigrants | Guatemala | 0.0 /100 | #342 | Tragic 87.4% |
| Yakama | 0.0 /100 | #343 | Tragic 86.9% |
| Immigrants | El Salvador | 0.0 /100 | #344 | Tragic 86.8% |
| Immigrants | Central America | 0.0 /100 | #345 | Tragic 86.6% |
| Spanish American Indians | 0.0 /100 | #346 | Tragic 86.2% |
| Immigrants | Mexico | 0.0 /100 | #347 | Tragic 86.2% |