Immigrants from Hong Kong vs Immigrants from Yemen Bachelor's Degree
COMPARE
Immigrants from Hong Kong
Immigrants from Yemen
Bachelor's Degree
Bachelor's Degree Comparison
Immigrants from Hong Kong
Immigrants from Yemen
48.2%
BACHELOR'S DEGREE
100.0/ 100
METRIC RATING
14th/ 347
METRIC RANK
29.9%
BACHELOR'S DEGREE
0.0/ 100
METRIC RATING
306th/ 347
METRIC RANK
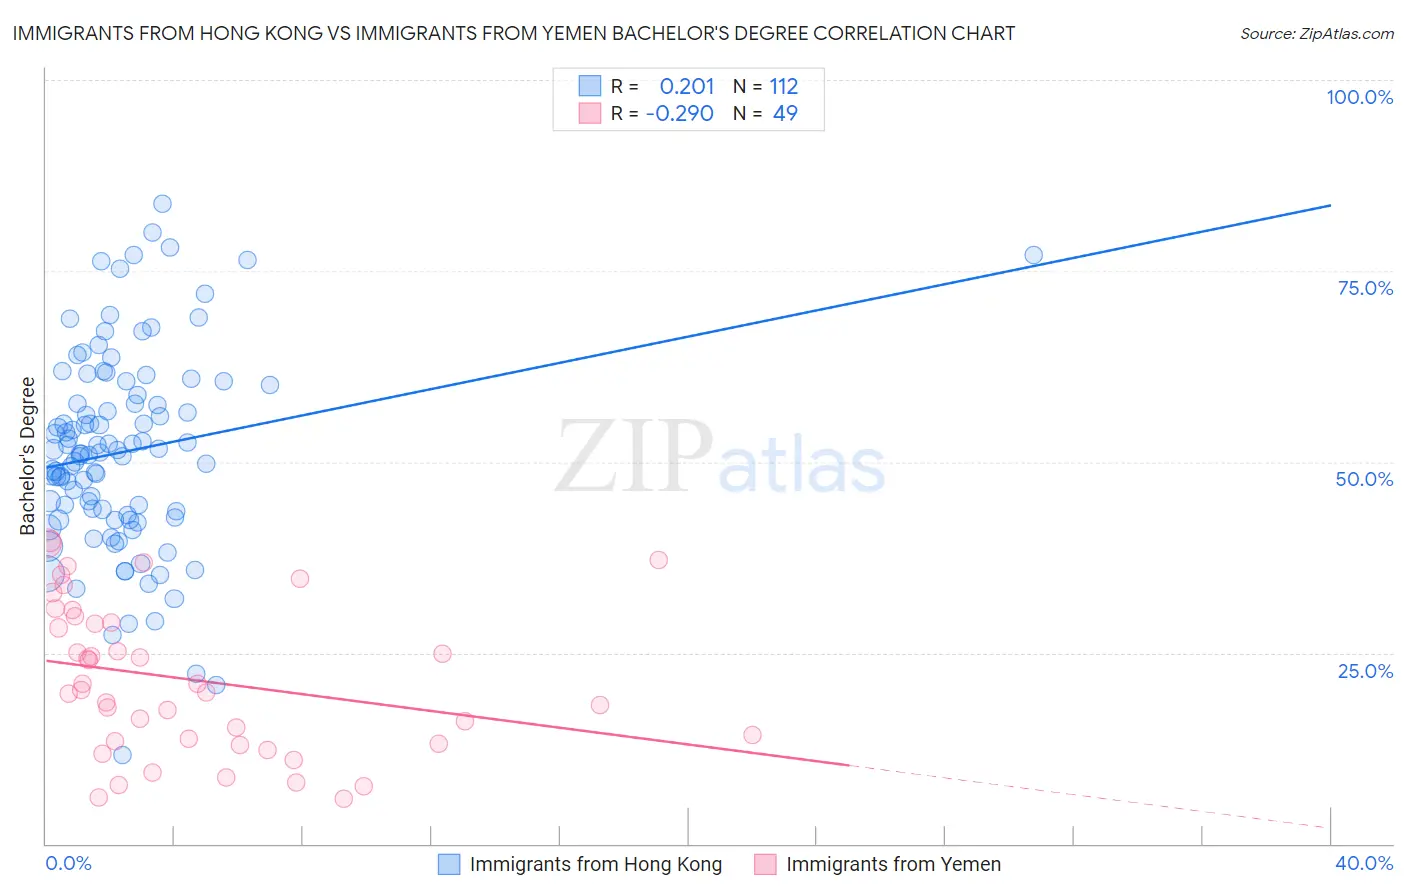
Immigrants from Hong Kong vs Immigrants from Yemen Bachelor's Degree Correlation Chart
The statistical analysis conducted on geographies consisting of 253,986,152 people shows a weak positive correlation between the proportion of Immigrants from Hong Kong and percentage of population with at least bachelor's degree education in the United States with a correlation coefficient (R) of 0.201 and weighted average of 48.2%. Similarly, the statistical analysis conducted on geographies consisting of 82,429,885 people shows a weak negative correlation between the proportion of Immigrants from Yemen and percentage of population with at least bachelor's degree education in the United States with a correlation coefficient (R) of -0.290 and weighted average of 29.9%, a difference of 61.2%.
Bachelor's Degree Correlation Summary
| Measurement | Immigrants from Hong Kong | Immigrants from Yemen |
| Minimum | 11.7% | 5.8% |
| Maximum | 83.9% | 39.6% |
| Range | 72.2% | 33.8% |
| Mean | 51.3% | 21.5% |
| Median | 51.2% | 20.1% |
| Interquartile 25% (IQ1) | 42.9% | 13.3% |
| Interquartile 75% (IQ3) | 59.4% | 29.4% |
| Interquartile Range (IQR) | 16.5% | 16.1% |
| Standard Deviation (Sample) | 13.2% | 9.8% |
| Standard Deviation (Population) | 13.1% | 9.7% |
Similar Demographics by Bachelor's Degree
Demographics Similar to Immigrants from Hong Kong by Bachelor's Degree
In terms of bachelor's degree, the demographic groups most similar to Immigrants from Hong Kong are Immigrants from Eastern Asia (48.1%, a difference of 0.14%), Immigrants from South Central Asia (48.3%, a difference of 0.28%), Immigrants from China (48.4%, a difference of 0.42%), Immigrants from Australia (48.5%, a difference of 0.60%), and Soviet Union (47.9%, a difference of 0.60%).
| Demographics | Rating | Rank | Bachelor's Degree |
| Immigrants | Iran | 100.0 /100 | #7 | Exceptional 50.3% |
| Thais | 100.0 /100 | #8 | Exceptional 50.1% |
| Immigrants | Israel | 100.0 /100 | #9 | Exceptional 50.0% |
| Cypriots | 100.0 /100 | #10 | Exceptional 49.0% |
| Immigrants | Australia | 100.0 /100 | #11 | Exceptional 48.5% |
| Immigrants | China | 100.0 /100 | #12 | Exceptional 48.4% |
| Immigrants | South Central Asia | 100.0 /100 | #13 | Exceptional 48.3% |
| Immigrants | Hong Kong | 100.0 /100 | #14 | Exceptional 48.2% |
| Immigrants | Eastern Asia | 100.0 /100 | #15 | Exceptional 48.1% |
| Soviet Union | 100.0 /100 | #16 | Exceptional 47.9% |
| Eastern Europeans | 100.0 /100 | #17 | Exceptional 47.5% |
| Indians (Asian) | 100.0 /100 | #18 | Exceptional 47.4% |
| Cambodians | 100.0 /100 | #19 | Exceptional 47.2% |
| Immigrants | Switzerland | 100.0 /100 | #20 | Exceptional 47.1% |
| Immigrants | Ireland | 100.0 /100 | #21 | Exceptional 47.1% |
Demographics Similar to Immigrants from Yemen by Bachelor's Degree
In terms of bachelor's degree, the demographic groups most similar to Immigrants from Yemen are Nepalese (29.9%, a difference of 0.040%), Immigrants from Latin America (30.1%, a difference of 0.55%), Cajun (29.6%, a difference of 0.89%), Cherokee (30.2%, a difference of 0.97%), and Bangladeshi (30.2%, a difference of 0.98%).
| Demographics | Rating | Rank | Bachelor's Degree |
| Chickasaw | 0.0 /100 | #299 | Tragic 30.4% |
| Immigrants | Micronesia | 0.0 /100 | #300 | Tragic 30.4% |
| Immigrants | Cuba | 0.0 /100 | #301 | Tragic 30.3% |
| Mexican American Indians | 0.0 /100 | #302 | Tragic 30.2% |
| Bangladeshis | 0.0 /100 | #303 | Tragic 30.2% |
| Cherokee | 0.0 /100 | #304 | Tragic 30.2% |
| Immigrants | Latin America | 0.0 /100 | #305 | Tragic 30.1% |
| Immigrants | Yemen | 0.0 /100 | #306 | Tragic 29.9% |
| Nepalese | 0.0 /100 | #307 | Tragic 29.9% |
| Cajuns | 0.0 /100 | #308 | Tragic 29.6% |
| Hispanics or Latinos | 0.0 /100 | #309 | Tragic 29.6% |
| Cheyenne | 0.0 /100 | #310 | Tragic 29.4% |
| Choctaw | 0.0 /100 | #311 | Tragic 29.4% |
| Seminole | 0.0 /100 | #312 | Tragic 29.4% |
| Alaska Natives | 0.0 /100 | #313 | Tragic 29.4% |