Dutch West Indian vs Immigrants from Yemen Bachelor's Degree
COMPARE
Dutch West Indian
Immigrants from Yemen
Bachelor's Degree
Bachelor's Degree Comparison
Dutch West Indians
Immigrants from Yemen
28.5%
BACHELOR'S DEGREE
0.0/ 100
METRIC RATING
324th/ 347
METRIC RANK
29.9%
BACHELOR'S DEGREE
0.0/ 100
METRIC RATING
306th/ 347
METRIC RANK
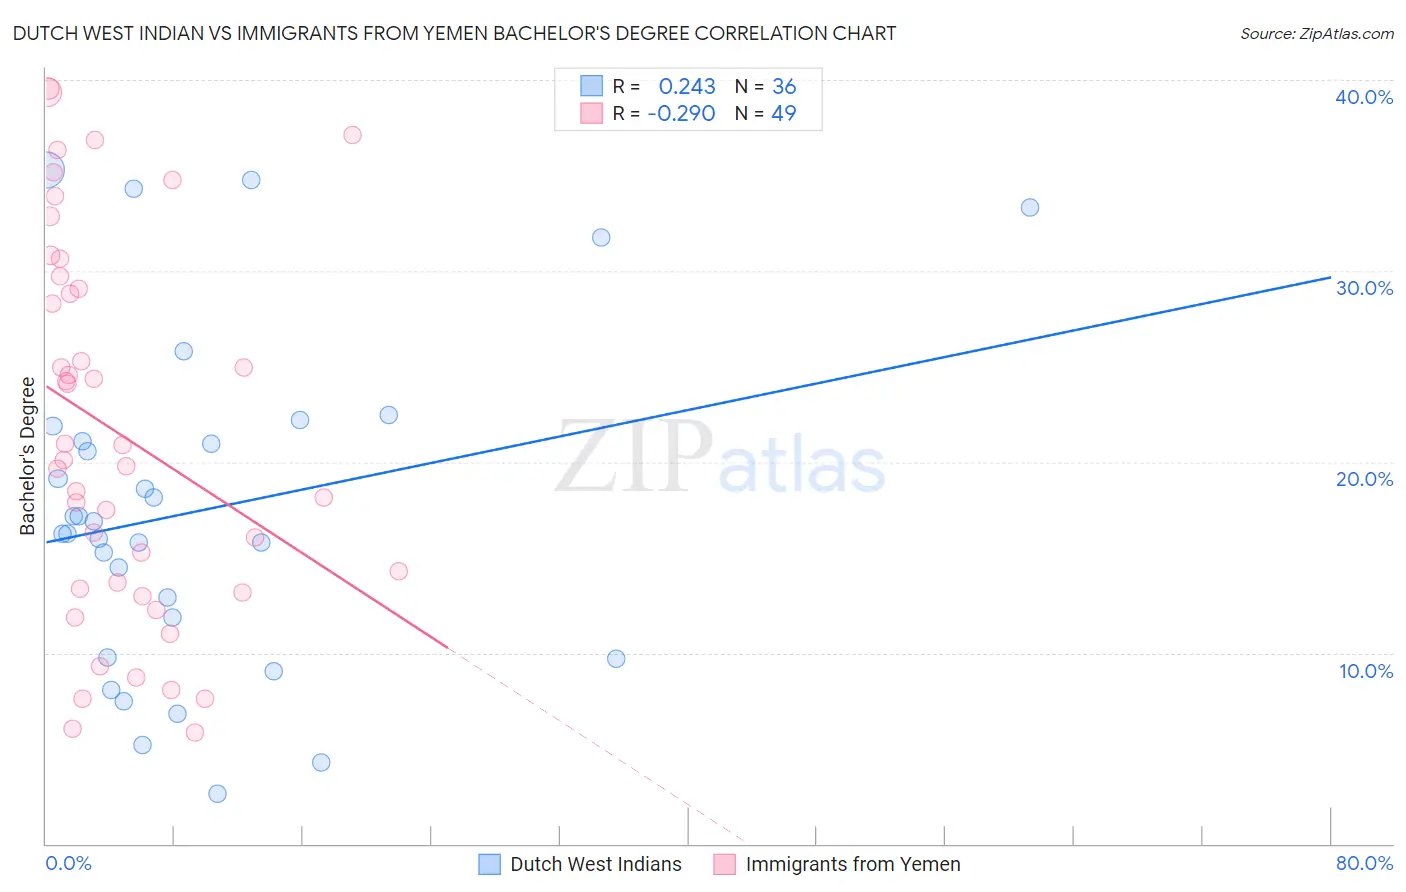
Dutch West Indian vs Immigrants from Yemen Bachelor's Degree Correlation Chart
The statistical analysis conducted on geographies consisting of 85,775,011 people shows a weak positive correlation between the proportion of Dutch West Indians and percentage of population with at least bachelor's degree education in the United States with a correlation coefficient (R) of 0.243 and weighted average of 28.5%. Similarly, the statistical analysis conducted on geographies consisting of 82,429,885 people shows a weak negative correlation between the proportion of Immigrants from Yemen and percentage of population with at least bachelor's degree education in the United States with a correlation coefficient (R) of -0.290 and weighted average of 29.9%, a difference of 4.9%.
Bachelor's Degree Correlation Summary
| Measurement | Dutch West Indian | Immigrants from Yemen |
| Minimum | 2.6% | 5.8% |
| Maximum | 35.3% | 39.6% |
| Range | 32.6% | 33.8% |
| Mean | 17.5% | 21.5% |
| Median | 16.6% | 20.1% |
| Interquartile 25% (IQ1) | 10.8% | 13.3% |
| Interquartile 75% (IQ3) | 21.5% | 29.4% |
| Interquartile Range (IQR) | 10.7% | 16.1% |
| Standard Deviation (Sample) | 8.7% | 9.8% |
| Standard Deviation (Population) | 8.6% | 9.7% |
Demographics Similar to Dutch West Indians and Immigrants from Yemen by Bachelor's Degree
In terms of bachelor's degree, the demographic groups most similar to Dutch West Indians are Pennsylvania German (28.4%, a difference of 0.45%), Fijian (28.7%, a difference of 0.71%), Tsimshian (28.8%, a difference of 0.85%), Alaskan Athabascan (28.8%, a difference of 1.1%), and Kiowa (28.8%, a difference of 1.2%). Similarly, the demographic groups most similar to Immigrants from Yemen are Nepalese (29.9%, a difference of 0.040%), Immigrants from Latin America (30.1%, a difference of 0.55%), Cajun (29.6%, a difference of 0.89%), Hispanic or Latino (29.6%, a difference of 1.1%), and Cheyenne (29.4%, a difference of 1.5%).
| Demographics | Rating | Rank | Bachelor's Degree |
| Immigrants | Latin America | 0.0 /100 | #305 | Tragic 30.1% |
| Immigrants | Yemen | 0.0 /100 | #306 | Tragic 29.9% |
| Nepalese | 0.0 /100 | #307 | Tragic 29.9% |
| Cajuns | 0.0 /100 | #308 | Tragic 29.6% |
| Hispanics or Latinos | 0.0 /100 | #309 | Tragic 29.6% |
| Cheyenne | 0.0 /100 | #310 | Tragic 29.4% |
| Choctaw | 0.0 /100 | #311 | Tragic 29.4% |
| Seminole | 0.0 /100 | #312 | Tragic 29.4% |
| Alaska Natives | 0.0 /100 | #313 | Tragic 29.4% |
| Shoshone | 0.0 /100 | #314 | Tragic 29.3% |
| Immigrants | Cabo Verde | 0.0 /100 | #315 | Tragic 29.2% |
| Sioux | 0.0 /100 | #316 | Tragic 29.1% |
| Colville | 0.0 /100 | #317 | Tragic 29.0% |
| Yaqui | 0.0 /100 | #318 | Tragic 29.0% |
| Creek | 0.0 /100 | #319 | Tragic 28.9% |
| Kiowa | 0.0 /100 | #320 | Tragic 28.8% |
| Alaskan Athabascans | 0.0 /100 | #321 | Tragic 28.8% |
| Tsimshian | 0.0 /100 | #322 | Tragic 28.8% |
| Fijians | 0.0 /100 | #323 | Tragic 28.7% |
| Dutch West Indians | 0.0 /100 | #324 | Tragic 28.5% |
| Pennsylvania Germans | 0.0 /100 | #325 | Tragic 28.4% |