Immigrants from Panama vs Potawatomi Unemployment Among Ages 60 to 64 years
COMPARE
Immigrants from Panama
Potawatomi
Unemployment Among Ages 60 to 64 years
Unemployment Among Ages 60 to 64 years Comparison
Immigrants from Panama
Potawatomi
4.8%
UNEMPLOYMENT AMONG AGES 60 TO 64 YEARS
62.0/ 100
METRIC RATING
165th/ 347
METRIC RANK
4.6%
UNEMPLOYMENT AMONG AGES 60 TO 64 YEARS
99.3/ 100
METRIC RATING
75th/ 347
METRIC RANK
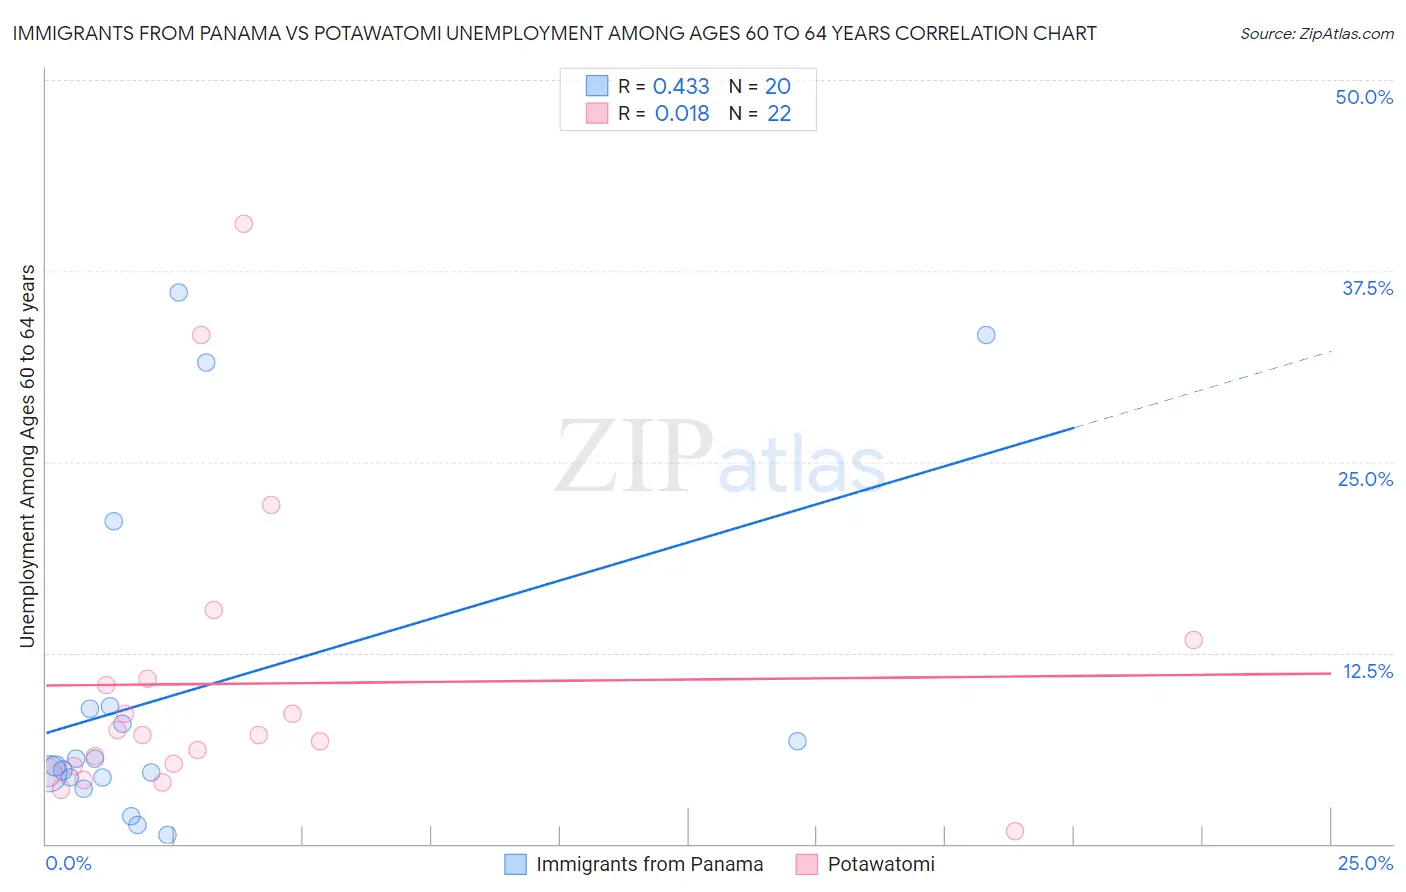
Immigrants from Panama vs Potawatomi Unemployment Among Ages 60 to 64 years Correlation Chart
The statistical analysis conducted on geographies consisting of 209,136,468 people shows a moderate positive correlation between the proportion of Immigrants from Panama and unemployment rate among population between the ages 60 and 64 in the United States with a correlation coefficient (R) of 0.433 and weighted average of 4.8%. Similarly, the statistical analysis conducted on geographies consisting of 110,784,914 people shows no correlation between the proportion of Potawatomi and unemployment rate among population between the ages 60 and 64 in the United States with a correlation coefficient (R) of 0.018 and weighted average of 4.6%, a difference of 4.1%.
Unemployment Among Ages 60 to 64 years Correlation Summary
| Measurement | Immigrants from Panama | Potawatomi |
| Minimum | 0.60% | 0.80% |
| Maximum | 36.1% | 40.6% |
| Range | 35.5% | 39.8% |
| Mean | 10.0% | 10.5% |
| Median | 5.3% | 7.1% |
| Interquartile 25% (IQ1) | 4.4% | 5.1% |
| Interquartile 75% (IQ3) | 8.9% | 10.8% |
| Interquartile Range (IQR) | 4.6% | 5.7% |
| Standard Deviation (Sample) | 11.0% | 9.8% |
| Standard Deviation (Population) | 10.7% | 9.5% |
Similar Demographics by Unemployment Among Ages 60 to 64 years
Demographics Similar to Immigrants from Panama by Unemployment Among Ages 60 to 64 years
In terms of unemployment among ages 60 to 64 years, the demographic groups most similar to Immigrants from Panama are Palestinian (4.8%, a difference of 0.060%), Immigrants from Belgium (4.8%, a difference of 0.10%), Pakistani (4.8%, a difference of 0.10%), Immigrants from Northern Europe (4.8%, a difference of 0.11%), and Australian (4.8%, a difference of 0.12%).
| Demographics | Rating | Rank | Unemployment Among Ages 60 to 64 years |
| Immigrants | Taiwan | 66.0 /100 | #158 | Good 4.8% |
| Spanish | 65.5 /100 | #159 | Good 4.8% |
| Australians | 65.3 /100 | #160 | Good 4.8% |
| Immigrants | Norway | 65.1 /100 | #161 | Good 4.8% |
| South Africans | 65.1 /100 | #162 | Good 4.8% |
| Immigrants | Belgium | 64.8 /100 | #163 | Good 4.8% |
| Pakistanis | 64.6 /100 | #164 | Good 4.8% |
| Immigrants | Panama | 62.0 /100 | #165 | Good 4.8% |
| Palestinians | 60.5 /100 | #166 | Good 4.8% |
| Immigrants | Northern Europe | 59.1 /100 | #167 | Average 4.8% |
| Immigrants | Southern Europe | 56.7 /100 | #168 | Average 4.8% |
| Immigrants | France | 55.5 /100 | #169 | Average 4.8% |
| Immigrants | Korea | 54.2 /100 | #170 | Average 4.8% |
| Samoans | 53.6 /100 | #171 | Average 4.9% |
| Immigrants | Turkey | 52.8 /100 | #172 | Average 4.9% |
Demographics Similar to Potawatomi by Unemployment Among Ages 60 to 64 years
In terms of unemployment among ages 60 to 64 years, the demographic groups most similar to Potawatomi are Slovak (4.6%, a difference of 0.030%), Immigrants from Somalia (4.6%, a difference of 0.050%), Northern European (4.6%, a difference of 0.090%), Seminole (4.7%, a difference of 0.11%), and Irish (4.7%, a difference of 0.13%).
| Demographics | Rating | Rank | Unemployment Among Ages 60 to 64 years |
| Immigrants | Laos | 99.6 /100 | #68 | Exceptional 4.6% |
| Creek | 99.6 /100 | #69 | Exceptional 4.6% |
| Croatians | 99.5 /100 | #70 | Exceptional 4.6% |
| Slavs | 99.5 /100 | #71 | Exceptional 4.6% |
| Tongans | 99.5 /100 | #72 | Exceptional 4.6% |
| Immigrants | Eastern Africa | 99.5 /100 | #73 | Exceptional 4.6% |
| Northern Europeans | 99.3 /100 | #74 | Exceptional 4.6% |
| Potawatomi | 99.3 /100 | #75 | Exceptional 4.6% |
| Slovaks | 99.3 /100 | #76 | Exceptional 4.6% |
| Immigrants | Somalia | 99.2 /100 | #77 | Exceptional 4.6% |
| Seminole | 99.2 /100 | #78 | Exceptional 4.7% |
| Irish | 99.2 /100 | #79 | Exceptional 4.7% |
| Icelanders | 99.1 /100 | #80 | Exceptional 4.7% |
| Iroquois | 99.1 /100 | #81 | Exceptional 4.7% |
| Okinawans | 99.1 /100 | #82 | Exceptional 4.7% |