Immigrants from Norway vs Slavic 11th Grade
COMPARE
Immigrants from Norway
Slavic
11th Grade
11th Grade Comparison
Immigrants from Norway
Slavs
93.5%
11TH GRADE
98.4/ 100
METRIC RATING
107th/ 347
METRIC RANK
94.1%
11TH GRADE
99.9/ 100
METRIC RATING
49th/ 347
METRIC RANK
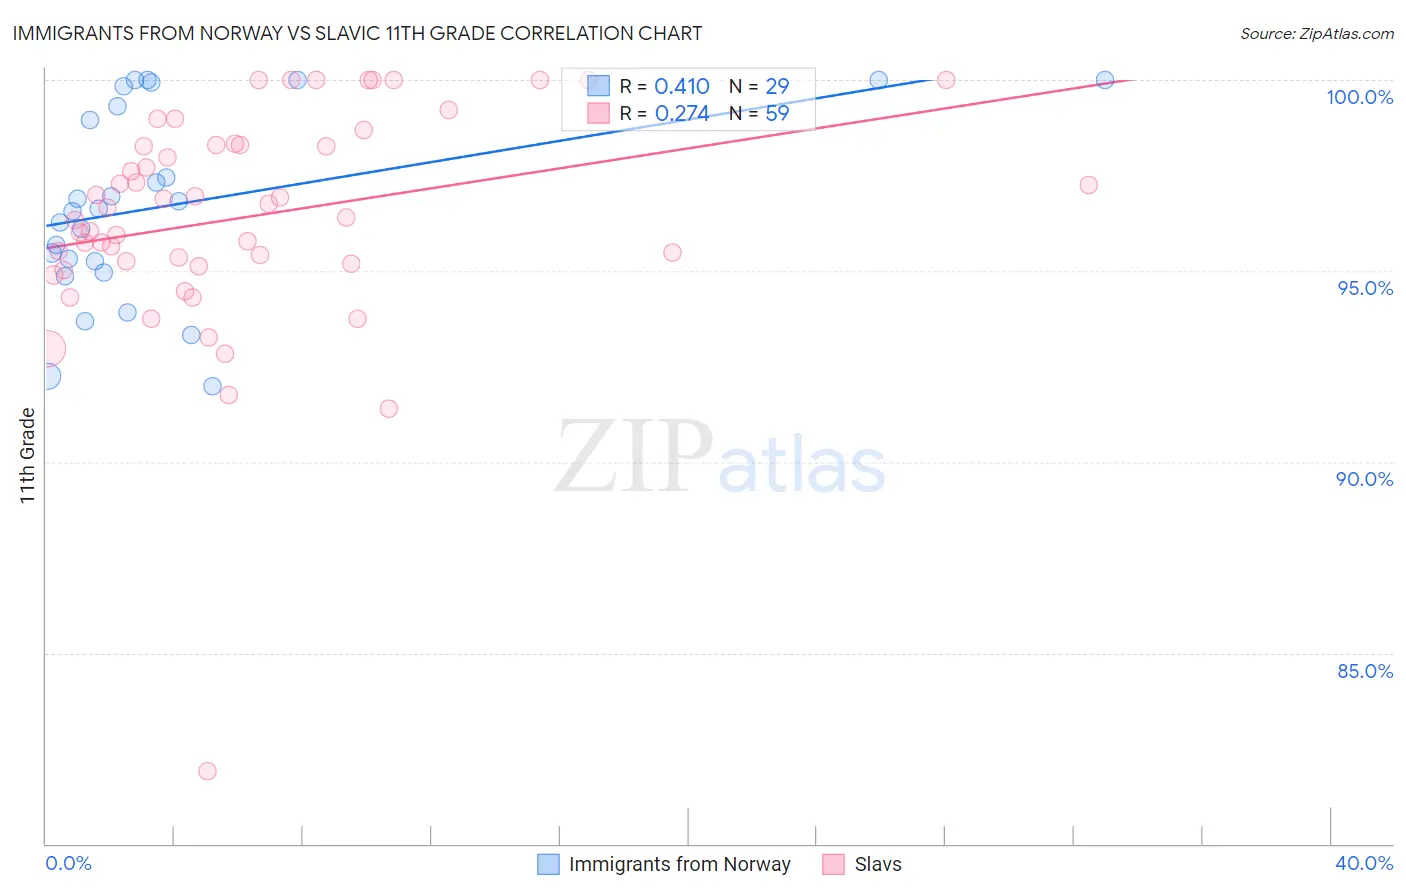
Immigrants from Norway vs Slavic 11th Grade Correlation Chart
The statistical analysis conducted on geographies consisting of 116,716,420 people shows a moderate positive correlation between the proportion of Immigrants from Norway and percentage of population with at least 11th grade education in the United States with a correlation coefficient (R) of 0.410 and weighted average of 93.5%. Similarly, the statistical analysis conducted on geographies consisting of 270,868,354 people shows a weak positive correlation between the proportion of Slavs and percentage of population with at least 11th grade education in the United States with a correlation coefficient (R) of 0.274 and weighted average of 94.1%, a difference of 0.65%.
11th Grade Correlation Summary
| Measurement | Immigrants from Norway | Slavic |
| Minimum | 92.0% | 81.9% |
| Maximum | 100.0% | 100.0% |
| Range | 8.0% | 18.1% |
| Mean | 96.8% | 96.4% |
| Median | 96.6% | 96.7% |
| Interquartile 25% (IQ1) | 95.1% | 95.2% |
| Interquartile 75% (IQ3) | 99.6% | 98.3% |
| Interquartile Range (IQR) | 4.5% | 3.1% |
| Standard Deviation (Sample) | 2.5% | 2.9% |
| Standard Deviation (Population) | 2.4% | 2.9% |
Similar Demographics by 11th Grade
Demographics Similar to Immigrants from Norway by 11th Grade
In terms of 11th grade, the demographic groups most similar to Immigrants from Norway are Alaska Native (93.5%, a difference of 0.0%), Immigrants from Kuwait (93.5%, a difference of 0.010%), Syrian (93.4%, a difference of 0.010%), Lebanese (93.5%, a difference of 0.020%), and Immigrants from Europe (93.5%, a difference of 0.020%).
| Demographics | Rating | Rank | 11th Grade |
| Immigrants | North Macedonia | 98.7 /100 | #100 | Exceptional 93.5% |
| Immigrants | Romania | 98.7 /100 | #101 | Exceptional 93.5% |
| Chippewa | 98.6 /100 | #102 | Exceptional 93.5% |
| Lebanese | 98.6 /100 | #103 | Exceptional 93.5% |
| Immigrants | Europe | 98.6 /100 | #104 | Exceptional 93.5% |
| Immigrants | Serbia | 98.6 /100 | #105 | Exceptional 93.5% |
| Immigrants | Croatia | 98.6 /100 | #106 | Exceptional 93.5% |
| Immigrants | Norway | 98.4 /100 | #107 | Exceptional 93.5% |
| Alaska Natives | 98.4 /100 | #108 | Exceptional 93.5% |
| Immigrants | Kuwait | 98.4 /100 | #109 | Exceptional 93.5% |
| Syrians | 98.4 /100 | #110 | Exceptional 93.4% |
| Yugoslavians | 98.1 /100 | #111 | Exceptional 93.4% |
| Immigrants | Germany | 98.0 /100 | #112 | Exceptional 93.4% |
| Immigrants | Zimbabwe | 97.8 /100 | #113 | Exceptional 93.4% |
| Jordanians | 97.8 /100 | #114 | Exceptional 93.4% |
Demographics Similar to Slavs by 11th Grade
In terms of 11th grade, the demographic groups most similar to Slavs are Filipino (94.1%, a difference of 0.0%), Macedonian (94.1%, a difference of 0.0%), French (94.1%, a difference of 0.0%), Serbian (94.1%, a difference of 0.010%), and Australian (94.1%, a difference of 0.020%).
| Demographics | Rating | Rank | 11th Grade |
| Immigrants | Austria | 99.9 /100 | #42 | Exceptional 94.1% |
| Greeks | 99.9 /100 | #43 | Exceptional 94.1% |
| Immigrants | Ireland | 99.9 /100 | #44 | Exceptional 94.1% |
| Australians | 99.9 /100 | #45 | Exceptional 94.1% |
| Serbians | 99.9 /100 | #46 | Exceptional 94.1% |
| Filipinos | 99.9 /100 | #47 | Exceptional 94.1% |
| Macedonians | 99.9 /100 | #48 | Exceptional 94.1% |
| Slavs | 99.9 /100 | #49 | Exceptional 94.1% |
| French | 99.9 /100 | #50 | Exceptional 94.1% |
| Turks | 99.9 /100 | #51 | Exceptional 94.0% |
| Immigrants | Canada | 99.9 /100 | #52 | Exceptional 94.0% |
| Immigrants | Australia | 99.9 /100 | #53 | Exceptional 94.0% |
| Immigrants | North America | 99.9 /100 | #54 | Exceptional 94.0% |
| Czechoslovakians | 99.9 /100 | #55 | Exceptional 94.0% |
| French Canadians | 99.9 /100 | #56 | Exceptional 94.0% |