Immigrants from Hungary vs Venezuelan 11th Grade
COMPARE
Immigrants from Hungary
Venezuelan
11th Grade
11th Grade Comparison
Immigrants from Hungary
Venezuelans
93.4%
11TH GRADE
97.5/ 100
METRIC RATING
116th/ 347
METRIC RANK
92.9%
11TH GRADE
83.4/ 100
METRIC RATING
140th/ 347
METRIC RANK
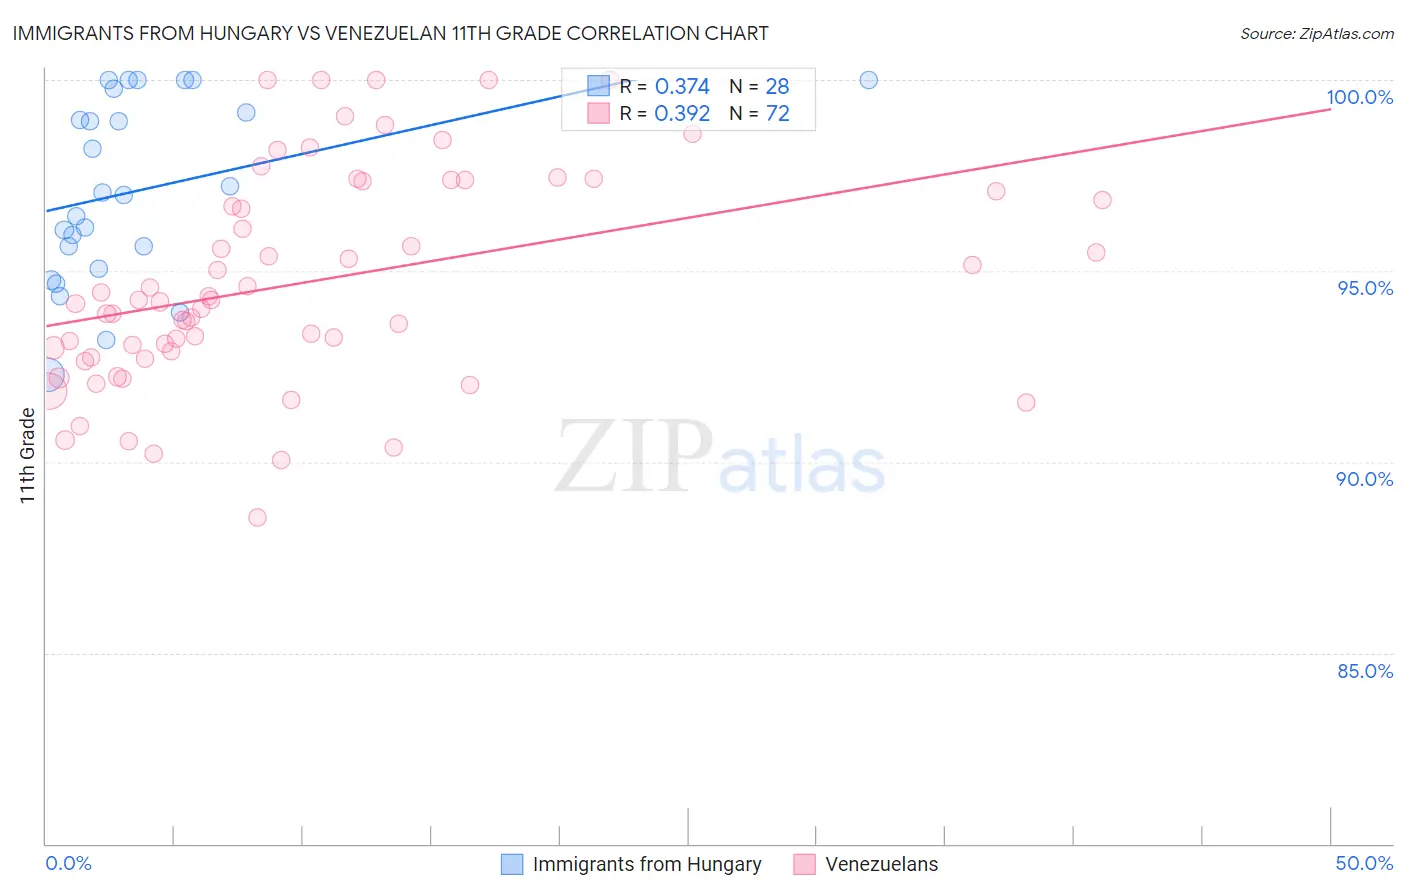
Immigrants from Hungary vs Venezuelan 11th Grade Correlation Chart
The statistical analysis conducted on geographies consisting of 195,707,305 people shows a mild positive correlation between the proportion of Immigrants from Hungary and percentage of population with at least 11th grade education in the United States with a correlation coefficient (R) of 0.374 and weighted average of 93.4%. Similarly, the statistical analysis conducted on geographies consisting of 306,323,887 people shows a mild positive correlation between the proportion of Venezuelans and percentage of population with at least 11th grade education in the United States with a correlation coefficient (R) of 0.392 and weighted average of 92.9%, a difference of 0.50%.
11th Grade Correlation Summary
| Measurement | Immigrants from Hungary | Venezuelan |
| Minimum | 92.3% | 88.5% |
| Maximum | 100.0% | 100.0% |
| Range | 7.7% | 11.5% |
| Mean | 97.1% | 94.7% |
| Median | 97.0% | 94.2% |
| Interquartile 25% (IQ1) | 95.4% | 92.8% |
| Interquartile 75% (IQ3) | 99.5% | 97.2% |
| Interquartile Range (IQR) | 4.1% | 4.4% |
| Standard Deviation (Sample) | 2.4% | 2.8% |
| Standard Deviation (Population) | 2.3% | 2.8% |
Similar Demographics by 11th Grade
Demographics Similar to Immigrants from Hungary by 11th Grade
In terms of 11th grade, the demographic groups most similar to Immigrants from Hungary are White/Caucasian (93.3%, a difference of 0.010%), Palestinian (93.4%, a difference of 0.020%), Immigrants from Zimbabwe (93.4%, a difference of 0.030%), Jordanian (93.4%, a difference of 0.030%), and Immigrants from Korea (93.3%, a difference of 0.050%).
| Demographics | Rating | Rank | 11th Grade |
| Immigrants | Kuwait | 98.4 /100 | #109 | Exceptional 93.5% |
| Syrians | 98.4 /100 | #110 | Exceptional 93.4% |
| Yugoslavians | 98.1 /100 | #111 | Exceptional 93.4% |
| Immigrants | Germany | 98.0 /100 | #112 | Exceptional 93.4% |
| Immigrants | Zimbabwe | 97.8 /100 | #113 | Exceptional 93.4% |
| Jordanians | 97.8 /100 | #114 | Exceptional 93.4% |
| Palestinians | 97.7 /100 | #115 | Exceptional 93.4% |
| Immigrants | Hungary | 97.5 /100 | #116 | Exceptional 93.4% |
| Whites/Caucasians | 97.4 /100 | #117 | Exceptional 93.3% |
| Immigrants | Korea | 97.0 /100 | #118 | Exceptional 93.3% |
| Israelis | 97.0 /100 | #119 | Exceptional 93.3% |
| Immigrants | Russia | 96.6 /100 | #120 | Exceptional 93.3% |
| German Russians | 96.4 /100 | #121 | Exceptional 93.3% |
| Immigrants | Belarus | 96.3 /100 | #122 | Exceptional 93.3% |
| Immigrants | Greece | 95.9 /100 | #123 | Exceptional 93.2% |
Demographics Similar to Venezuelans by 11th Grade
In terms of 11th grade, the demographic groups most similar to Venezuelans are Crow (92.9%, a difference of 0.010%), Chilean (92.9%, a difference of 0.010%), Kenyan (92.9%, a difference of 0.020%), Immigrants from Brazil (92.9%, a difference of 0.030%), and Ugandan (92.9%, a difference of 0.030%).
| Demographics | Rating | Rank | 11th Grade |
| Mongolians | 87.6 /100 | #133 | Excellent 93.0% |
| Delaware | 87.3 /100 | #134 | Excellent 93.0% |
| Immigrants | Italy | 86.6 /100 | #135 | Excellent 92.9% |
| Cree | 85.9 /100 | #136 | Excellent 92.9% |
| Arabs | 85.4 /100 | #137 | Excellent 92.9% |
| Immigrants | Brazil | 85.1 /100 | #138 | Excellent 92.9% |
| Crow | 84.1 /100 | #139 | Excellent 92.9% |
| Venezuelans | 83.4 /100 | #140 | Excellent 92.9% |
| Chileans | 83.0 /100 | #141 | Excellent 92.9% |
| Kenyans | 82.0 /100 | #142 | Excellent 92.9% |
| Ugandans | 81.4 /100 | #143 | Excellent 92.9% |
| Assyrians/Chaldeans/Syriacs | 80.5 /100 | #144 | Excellent 92.8% |
| Pakistanis | 79.6 /100 | #145 | Good 92.8% |
| Iroquois | 79.1 /100 | #146 | Good 92.8% |
| Immigrants | Kenya | 78.7 /100 | #147 | Good 92.8% |