Immigrants from Mexico vs Venezuelan 11th Grade
COMPARE
Immigrants from Mexico
Venezuelan
11th Grade
11th Grade Comparison
Immigrants from Mexico
Venezuelans
84.5%
11TH GRADE
0.0/ 100
METRIC RATING
347th/ 347
METRIC RANK
92.9%
11TH GRADE
83.4/ 100
METRIC RATING
140th/ 347
METRIC RANK
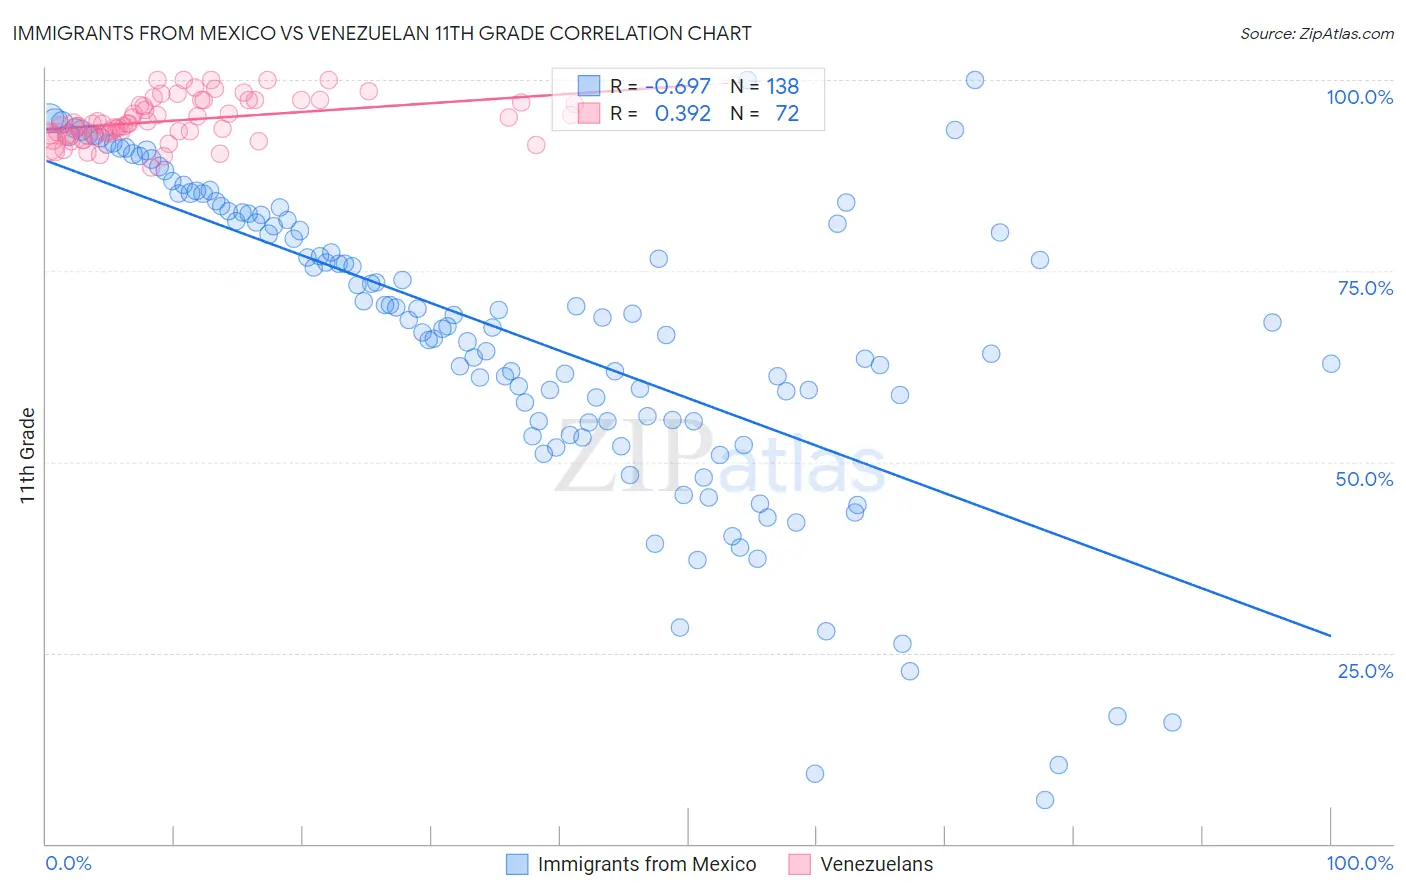
Immigrants from Mexico vs Venezuelan 11th Grade Correlation Chart
The statistical analysis conducted on geographies consisting of 513,766,645 people shows a significant negative correlation between the proportion of Immigrants from Mexico and percentage of population with at least 11th grade education in the United States with a correlation coefficient (R) of -0.697 and weighted average of 84.5%. Similarly, the statistical analysis conducted on geographies consisting of 306,323,887 people shows a mild positive correlation between the proportion of Venezuelans and percentage of population with at least 11th grade education in the United States with a correlation coefficient (R) of 0.392 and weighted average of 92.9%, a difference of 9.9%.
11th Grade Correlation Summary
| Measurement | Immigrants from Mexico | Venezuelan |
| Minimum | 5.7% | 88.5% |
| Maximum | 100.0% | 100.0% |
| Range | 94.3% | 11.5% |
| Mean | 67.1% | 94.7% |
| Median | 69.1% | 94.2% |
| Interquartile 25% (IQ1) | 55.4% | 92.8% |
| Interquartile 75% (IQ3) | 82.6% | 97.2% |
| Interquartile Range (IQR) | 27.3% | 4.4% |
| Standard Deviation (Sample) | 20.2% | 2.8% |
| Standard Deviation (Population) | 20.1% | 2.8% |
Similar Demographics by 11th Grade
Demographics Similar to Immigrants from Mexico by 11th Grade
In terms of 11th grade, the demographic groups most similar to Immigrants from Mexico are Spanish American Indian (84.7%, a difference of 0.30%), Immigrants from Central America (84.9%, a difference of 0.54%), Yakama (85.0%, a difference of 0.57%), Immigrants from El Salvador (85.3%, a difference of 0.98%), and Immigrants from Guatemala (85.8%, a difference of 1.6%).
| Demographics | Rating | Rank | 11th Grade |
| Immigrants | Yemen | 0.0 /100 | #333 | Tragic 87.1% |
| Houma | 0.0 /100 | #334 | Tragic 87.0% |
| Central Americans | 0.0 /100 | #335 | Tragic 86.9% |
| Immigrants | Dominican Republic | 0.0 /100 | #336 | Tragic 86.9% |
| Immigrants | Honduras | 0.0 /100 | #337 | Tragic 86.9% |
| Immigrants | Latin America | 0.0 /100 | #338 | Tragic 86.8% |
| Guatemalans | 0.0 /100 | #339 | Tragic 86.4% |
| Salvadorans | 0.0 /100 | #340 | Tragic 86.2% |
| Mexicans | 0.0 /100 | #341 | Tragic 86.1% |
| Immigrants | Guatemala | 0.0 /100 | #342 | Tragic 85.8% |
| Immigrants | El Salvador | 0.0 /100 | #343 | Tragic 85.3% |
| Yakama | 0.0 /100 | #344 | Tragic 85.0% |
| Immigrants | Central America | 0.0 /100 | #345 | Tragic 84.9% |
| Spanish American Indians | 0.0 /100 | #346 | Tragic 84.7% |
| Immigrants | Mexico | 0.0 /100 | #347 | Tragic 84.5% |
Demographics Similar to Venezuelans by 11th Grade
In terms of 11th grade, the demographic groups most similar to Venezuelans are Crow (92.9%, a difference of 0.010%), Chilean (92.9%, a difference of 0.010%), Kenyan (92.9%, a difference of 0.020%), Immigrants from Brazil (92.9%, a difference of 0.030%), and Ugandan (92.9%, a difference of 0.030%).
| Demographics | Rating | Rank | 11th Grade |
| Mongolians | 87.6 /100 | #133 | Excellent 93.0% |
| Delaware | 87.3 /100 | #134 | Excellent 93.0% |
| Immigrants | Italy | 86.6 /100 | #135 | Excellent 92.9% |
| Cree | 85.9 /100 | #136 | Excellent 92.9% |
| Arabs | 85.4 /100 | #137 | Excellent 92.9% |
| Immigrants | Brazil | 85.1 /100 | #138 | Excellent 92.9% |
| Crow | 84.1 /100 | #139 | Excellent 92.9% |
| Venezuelans | 83.4 /100 | #140 | Excellent 92.9% |
| Chileans | 83.0 /100 | #141 | Excellent 92.9% |
| Kenyans | 82.0 /100 | #142 | Excellent 92.9% |
| Ugandans | 81.4 /100 | #143 | Excellent 92.9% |
| Assyrians/Chaldeans/Syriacs | 80.5 /100 | #144 | Excellent 92.8% |
| Pakistanis | 79.6 /100 | #145 | Good 92.8% |
| Iroquois | 79.1 /100 | #146 | Good 92.8% |
| Immigrants | Kenya | 78.7 /100 | #147 | Good 92.8% |