Immigrants from Northern Europe vs Immigrants from Jordan 2nd Grade
COMPARE
Immigrants from Northern Europe
Immigrants from Jordan
2nd Grade
2nd Grade Comparison
Immigrants from Northern Europe
Immigrants from Jordan
98.3%
2ND GRADE
99.7/ 100
METRIC RATING
67th/ 347
METRIC RANK
97.9%
2ND GRADE
56.3/ 100
METRIC RATING
166th/ 347
METRIC RANK
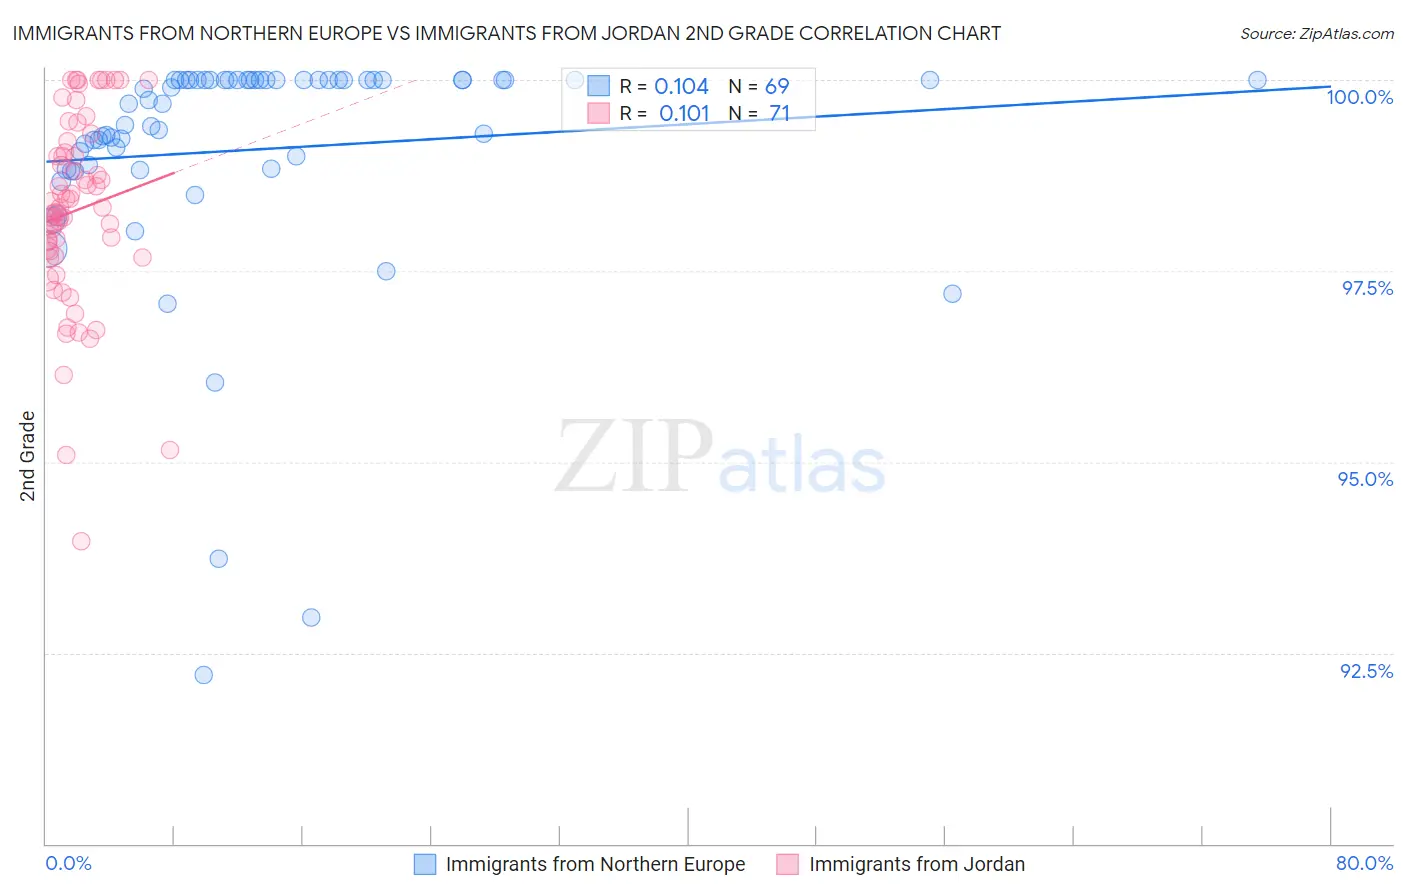
Immigrants from Northern Europe vs Immigrants from Jordan 2nd Grade Correlation Chart
The statistical analysis conducted on geographies consisting of 477,226,800 people shows a poor positive correlation between the proportion of Immigrants from Northern Europe and percentage of population with at least 2nd grade education in the United States with a correlation coefficient (R) of 0.104 and weighted average of 98.3%. Similarly, the statistical analysis conducted on geographies consisting of 181,269,915 people shows a poor positive correlation between the proportion of Immigrants from Jordan and percentage of population with at least 2nd grade education in the United States with a correlation coefficient (R) of 0.101 and weighted average of 97.9%, a difference of 0.43%.
2nd Grade Correlation Summary
| Measurement | Immigrants from Northern Europe | Immigrants from Jordan |
| Minimum | 92.2% | 94.0% |
| Maximum | 100.0% | 100.0% |
| Range | 7.8% | 6.0% |
| Mean | 99.1% | 98.3% |
| Median | 99.7% | 98.3% |
| Interquartile 25% (IQ1) | 98.8% | 97.7% |
| Interquartile 75% (IQ3) | 100.0% | 99.1% |
| Interquartile Range (IQR) | 1.2% | 1.4% |
| Standard Deviation (Sample) | 1.6% | 1.2% |
| Standard Deviation (Population) | 1.6% | 1.2% |
Similar Demographics by 2nd Grade
Demographics Similar to Immigrants from Northern Europe by 2nd Grade
In terms of 2nd grade, the demographic groups most similar to Immigrants from Northern Europe are Canadian (98.3%, a difference of 0.0%), Russian (98.3%, a difference of 0.0%), Immigrants from Austria (98.3%, a difference of 0.0%), Serbian (98.3%, a difference of 0.0%), and Chickasaw (98.3%, a difference of 0.010%).
| Demographics | Rating | Rank | 2nd Grade |
| Creek | 99.8 /100 | #60 | Exceptional 98.3% |
| Immigrants | Canada | 99.8 /100 | #61 | Exceptional 98.3% |
| Greeks | 99.8 /100 | #62 | Exceptional 98.3% |
| Maltese | 99.7 /100 | #63 | Exceptional 98.3% |
| Immigrants | North America | 99.7 /100 | #64 | Exceptional 98.3% |
| New Zealanders | 99.7 /100 | #65 | Exceptional 98.3% |
| Canadians | 99.7 /100 | #66 | Exceptional 98.3% |
| Immigrants | Northern Europe | 99.7 /100 | #67 | Exceptional 98.3% |
| Russians | 99.7 /100 | #68 | Exceptional 98.3% |
| Immigrants | Austria | 99.6 /100 | #69 | Exceptional 98.3% |
| Serbians | 99.6 /100 | #70 | Exceptional 98.3% |
| Chickasaw | 99.6 /100 | #71 | Exceptional 98.3% |
| Cheyenne | 99.6 /100 | #72 | Exceptional 98.3% |
| Cajuns | 99.5 /100 | #73 | Exceptional 98.3% |
| Immigrants | Netherlands | 99.4 /100 | #74 | Exceptional 98.3% |
Demographics Similar to Immigrants from Jordan by 2nd Grade
In terms of 2nd grade, the demographic groups most similar to Immigrants from Jordan are Ugandan (97.9%, a difference of 0.0%), Spanish American (97.9%, a difference of 0.0%), Chilean (97.9%, a difference of 0.0%), Brazilian (97.9%, a difference of 0.0%), and Immigrants from Spain (97.9%, a difference of 0.0%).
| Demographics | Rating | Rank | 2nd Grade |
| Comanche | 62.8 /100 | #159 | Good 97.9% |
| Immigrants | Eastern Europe | 61.1 /100 | #160 | Good 97.9% |
| Immigrants | Russia | 60.3 /100 | #161 | Good 97.9% |
| Immigrants | Italy | 60.2 /100 | #162 | Good 97.9% |
| Bermudans | 59.4 /100 | #163 | Average 97.9% |
| Ugandans | 56.6 /100 | #164 | Average 97.9% |
| Spanish Americans | 56.4 /100 | #165 | Average 97.9% |
| Immigrants | Jordan | 56.3 /100 | #166 | Average 97.9% |
| Chileans | 56.1 /100 | #167 | Average 97.9% |
| Brazilians | 55.8 /100 | #168 | Average 97.9% |
| Immigrants | Spain | 55.4 /100 | #169 | Average 97.9% |
| Navajo | 54.3 /100 | #170 | Average 97.9% |
| Albanians | 52.8 /100 | #171 | Average 97.9% |
| Immigrants | Korea | 52.7 /100 | #172 | Average 97.9% |
| Kenyans | 52.7 /100 | #173 | Average 97.9% |