Immigrants from North America vs Jordanian Bachelor's Degree
COMPARE
Immigrants from North America
Jordanian
Bachelor's Degree
Bachelor's Degree Comparison
Immigrants from North America
Jordanians
41.7%
BACHELOR'S DEGREE
98.5/ 100
METRIC RATING
95th/ 347
METRIC RANK
41.2%
BACHELOR'S DEGREE
97.4/ 100
METRIC RATING
104th/ 347
METRIC RANK
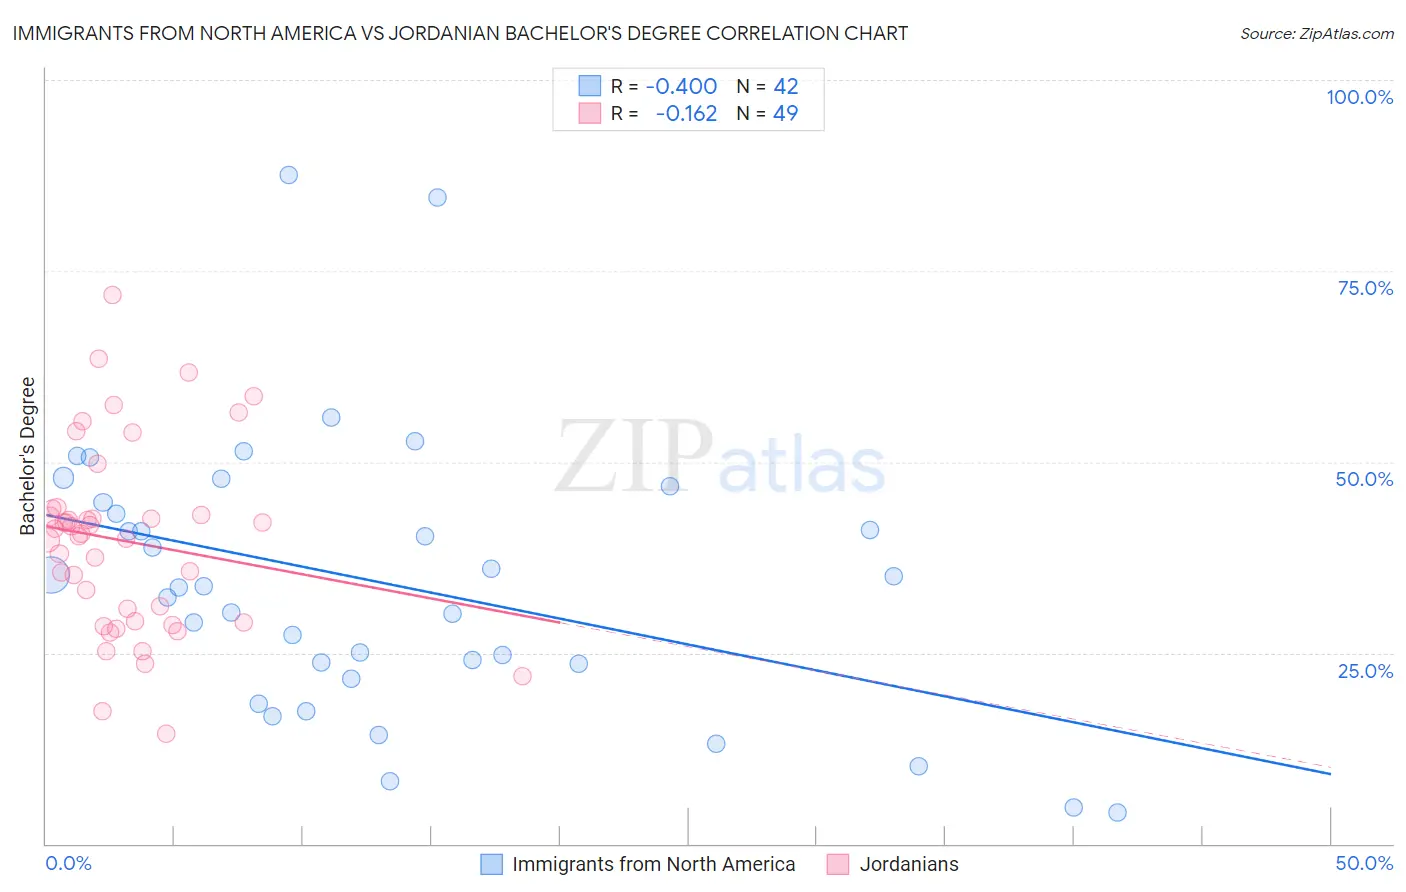
Immigrants from North America vs Jordanian Bachelor's Degree Correlation Chart
The statistical analysis conducted on geographies consisting of 462,429,202 people shows a mild negative correlation between the proportion of Immigrants from North America and percentage of population with at least bachelor's degree education in the United States with a correlation coefficient (R) of -0.400 and weighted average of 41.7%. Similarly, the statistical analysis conducted on geographies consisting of 166,421,482 people shows a poor negative correlation between the proportion of Jordanians and percentage of population with at least bachelor's degree education in the United States with a correlation coefficient (R) of -0.162 and weighted average of 41.2%, a difference of 1.2%.
Bachelor's Degree Correlation Summary
| Measurement | Immigrants from North America | Jordanian |
| Minimum | 4.2% | 14.4% |
| Maximum | 87.6% | 71.8% |
| Range | 83.5% | 57.4% |
| Mean | 34.2% | 39.6% |
| Median | 33.6% | 40.5% |
| Interquartile 25% (IQ1) | 23.5% | 29.1% |
| Interquartile 75% (IQ3) | 44.7% | 43.4% |
| Interquartile Range (IQR) | 21.2% | 14.3% |
| Standard Deviation (Sample) | 18.1% | 12.2% |
| Standard Deviation (Population) | 17.9% | 12.1% |
Demographics Similar to Immigrants from North America and Jordanians by Bachelor's Degree
In terms of bachelor's degree, the demographic groups most similar to Immigrants from North America are Immigrants from Moldova (41.6%, a difference of 0.11%), Immigrants from Nepal (41.7%, a difference of 0.12%), Immigrants from Canada (41.7%, a difference of 0.15%), Romanian (41.6%, a difference of 0.16%), and Immigrants from Ukraine (41.5%, a difference of 0.27%). Similarly, the demographic groups most similar to Jordanians are Syrian (41.1%, a difference of 0.030%), Chilean (41.2%, a difference of 0.060%), Alsatian (41.0%, a difference of 0.29%), Immigrants from Italy (41.3%, a difference of 0.40%), and Northern European (41.0%, a difference of 0.46%).
| Demographics | Rating | Rank | Bachelor's Degree |
| Greeks | 99.0 /100 | #89 | Exceptional 42.0% |
| Laotians | 98.9 /100 | #90 | Exceptional 42.0% |
| Immigrants | Northern Africa | 98.9 /100 | #91 | Exceptional 41.9% |
| Maltese | 98.8 /100 | #92 | Exceptional 41.9% |
| Immigrants | Canada | 98.6 /100 | #93 | Exceptional 41.7% |
| Immigrants | Nepal | 98.6 /100 | #94 | Exceptional 41.7% |
| Immigrants | North America | 98.5 /100 | #95 | Exceptional 41.7% |
| Immigrants | Moldova | 98.4 /100 | #96 | Exceptional 41.6% |
| Romanians | 98.4 /100 | #97 | Exceptional 41.6% |
| Immigrants | Ukraine | 98.3 /100 | #98 | Exceptional 41.5% |
| Immigrants | England | 98.1 /100 | #99 | Exceptional 41.4% |
| Macedonians | 98.1 /100 | #100 | Exceptional 41.4% |
| Immigrants | Morocco | 98.0 /100 | #101 | Exceptional 41.4% |
| Immigrants | Italy | 97.8 /100 | #102 | Exceptional 41.3% |
| Chileans | 97.5 /100 | #103 | Exceptional 41.2% |
| Jordanians | 97.4 /100 | #104 | Exceptional 41.2% |
| Syrians | 97.4 /100 | #105 | Exceptional 41.1% |
| Alsatians | 97.0 /100 | #106 | Exceptional 41.0% |
| Northern Europeans | 96.8 /100 | #107 | Exceptional 41.0% |
| Ukrainians | 96.6 /100 | #108 | Exceptional 40.9% |
| Arabs | 96.6 /100 | #109 | Exceptional 40.9% |