Dutch West Indian vs Jordanian Bachelor's Degree
COMPARE
Dutch West Indian
Jordanian
Bachelor's Degree
Bachelor's Degree Comparison
Dutch West Indians
Jordanians
28.5%
BACHELOR'S DEGREE
0.0/ 100
METRIC RATING
324th/ 347
METRIC RANK
41.2%
BACHELOR'S DEGREE
97.4/ 100
METRIC RATING
104th/ 347
METRIC RANK
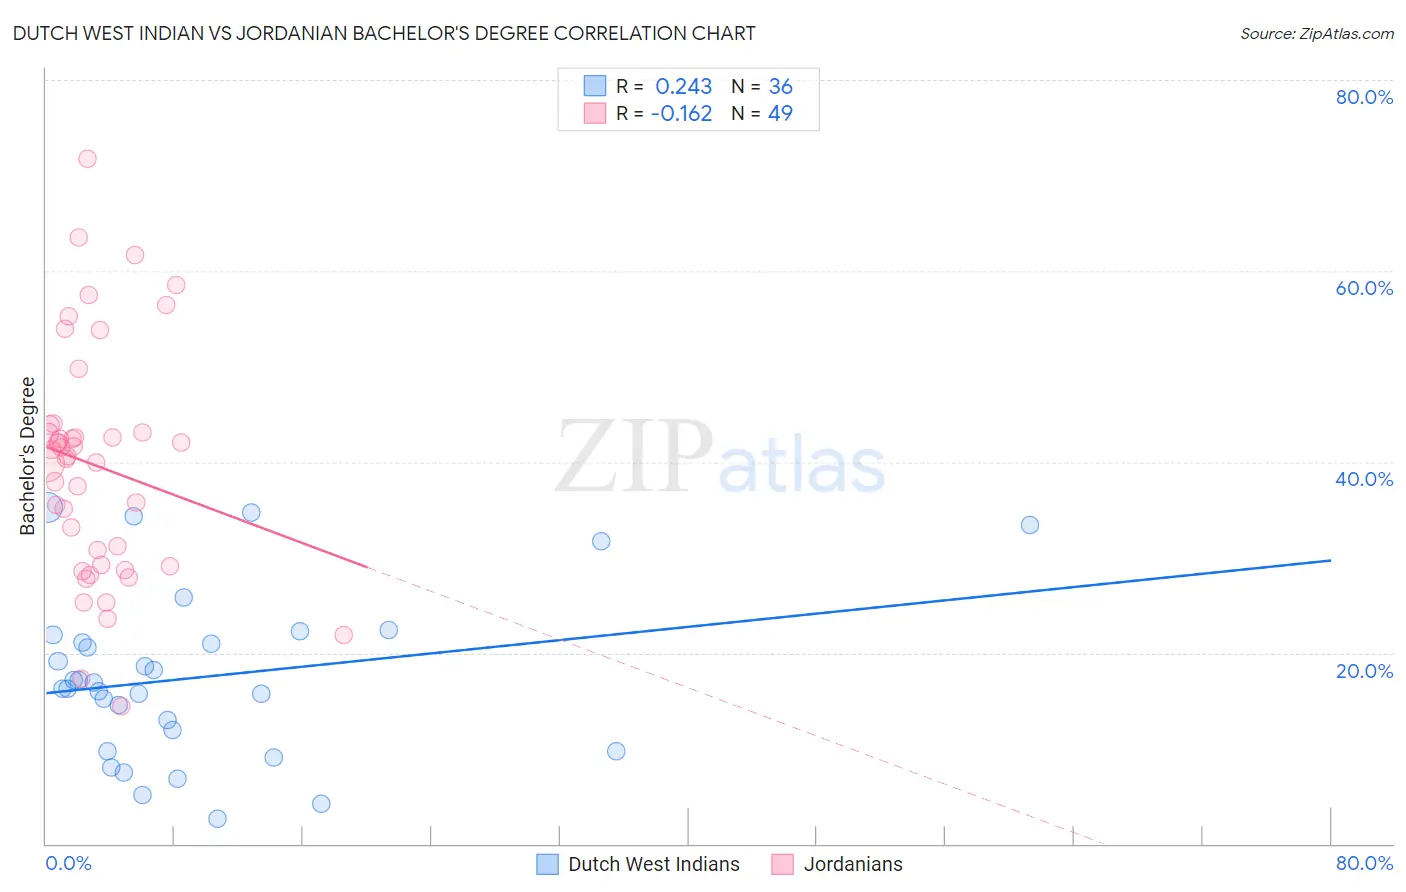
Dutch West Indian vs Jordanian Bachelor's Degree Correlation Chart
The statistical analysis conducted on geographies consisting of 85,775,011 people shows a weak positive correlation between the proportion of Dutch West Indians and percentage of population with at least bachelor's degree education in the United States with a correlation coefficient (R) of 0.243 and weighted average of 28.5%. Similarly, the statistical analysis conducted on geographies consisting of 166,421,482 people shows a poor negative correlation between the proportion of Jordanians and percentage of population with at least bachelor's degree education in the United States with a correlation coefficient (R) of -0.162 and weighted average of 41.2%, a difference of 44.3%.
Bachelor's Degree Correlation Summary
| Measurement | Dutch West Indian | Jordanian |
| Minimum | 2.6% | 14.4% |
| Maximum | 35.3% | 71.8% |
| Range | 32.6% | 57.4% |
| Mean | 17.5% | 39.6% |
| Median | 16.6% | 40.5% |
| Interquartile 25% (IQ1) | 10.8% | 29.1% |
| Interquartile 75% (IQ3) | 21.5% | 43.4% |
| Interquartile Range (IQR) | 10.7% | 14.3% |
| Standard Deviation (Sample) | 8.7% | 12.2% |
| Standard Deviation (Population) | 8.6% | 12.1% |
Similar Demographics by Bachelor's Degree
Demographics Similar to Dutch West Indians by Bachelor's Degree
In terms of bachelor's degree, the demographic groups most similar to Dutch West Indians are Pennsylvania German (28.4%, a difference of 0.45%), Fijian (28.7%, a difference of 0.71%), Apache (28.3%, a difference of 0.84%), Tsimshian (28.8%, a difference of 0.85%), and Alaskan Athabascan (28.8%, a difference of 1.1%).
| Demographics | Rating | Rank | Bachelor's Degree |
| Colville | 0.0 /100 | #317 | Tragic 29.0% |
| Yaqui | 0.0 /100 | #318 | Tragic 29.0% |
| Creek | 0.0 /100 | #319 | Tragic 28.9% |
| Kiowa | 0.0 /100 | #320 | Tragic 28.8% |
| Alaskan Athabascans | 0.0 /100 | #321 | Tragic 28.8% |
| Tsimshian | 0.0 /100 | #322 | Tragic 28.8% |
| Fijians | 0.0 /100 | #323 | Tragic 28.7% |
| Dutch West Indians | 0.0 /100 | #324 | Tragic 28.5% |
| Pennsylvania Germans | 0.0 /100 | #325 | Tragic 28.4% |
| Apache | 0.0 /100 | #326 | Tragic 28.3% |
| Paiute | 0.0 /100 | #327 | Tragic 28.1% |
| Crow | 0.0 /100 | #328 | Tragic 27.7% |
| Immigrants | Central America | 0.0 /100 | #329 | Tragic 27.5% |
| Spanish American Indians | 0.0 /100 | #330 | Tragic 27.5% |
| Immigrants | Azores | 0.0 /100 | #331 | Tragic 27.3% |
Demographics Similar to Jordanians by Bachelor's Degree
In terms of bachelor's degree, the demographic groups most similar to Jordanians are Syrian (41.1%, a difference of 0.030%), Chilean (41.2%, a difference of 0.060%), Alsatian (41.0%, a difference of 0.29%), Immigrants from Italy (41.3%, a difference of 0.40%), and Northern European (41.0%, a difference of 0.46%).
| Demographics | Rating | Rank | Bachelor's Degree |
| Romanians | 98.4 /100 | #97 | Exceptional 41.6% |
| Immigrants | Ukraine | 98.3 /100 | #98 | Exceptional 41.5% |
| Immigrants | England | 98.1 /100 | #99 | Exceptional 41.4% |
| Macedonians | 98.1 /100 | #100 | Exceptional 41.4% |
| Immigrants | Morocco | 98.0 /100 | #101 | Exceptional 41.4% |
| Immigrants | Italy | 97.8 /100 | #102 | Exceptional 41.3% |
| Chileans | 97.5 /100 | #103 | Exceptional 41.2% |
| Jordanians | 97.4 /100 | #104 | Exceptional 41.2% |
| Syrians | 97.4 /100 | #105 | Exceptional 41.1% |
| Alsatians | 97.0 /100 | #106 | Exceptional 41.0% |
| Northern Europeans | 96.8 /100 | #107 | Exceptional 41.0% |
| Ukrainians | 96.6 /100 | #108 | Exceptional 40.9% |
| Arabs | 96.6 /100 | #109 | Exceptional 40.9% |
| Albanians | 96.5 /100 | #110 | Exceptional 40.9% |
| Immigrants | Chile | 96.4 /100 | #111 | Exceptional 40.8% |