Immigrants from Cuba vs Jordanian Bachelor's Degree
COMPARE
Immigrants from Cuba
Jordanian
Bachelor's Degree
Bachelor's Degree Comparison
Immigrants from Cuba
Jordanians
30.3%
BACHELOR'S DEGREE
0.0/ 100
METRIC RATING
301st/ 347
METRIC RANK
41.2%
BACHELOR'S DEGREE
97.4/ 100
METRIC RATING
104th/ 347
METRIC RANK
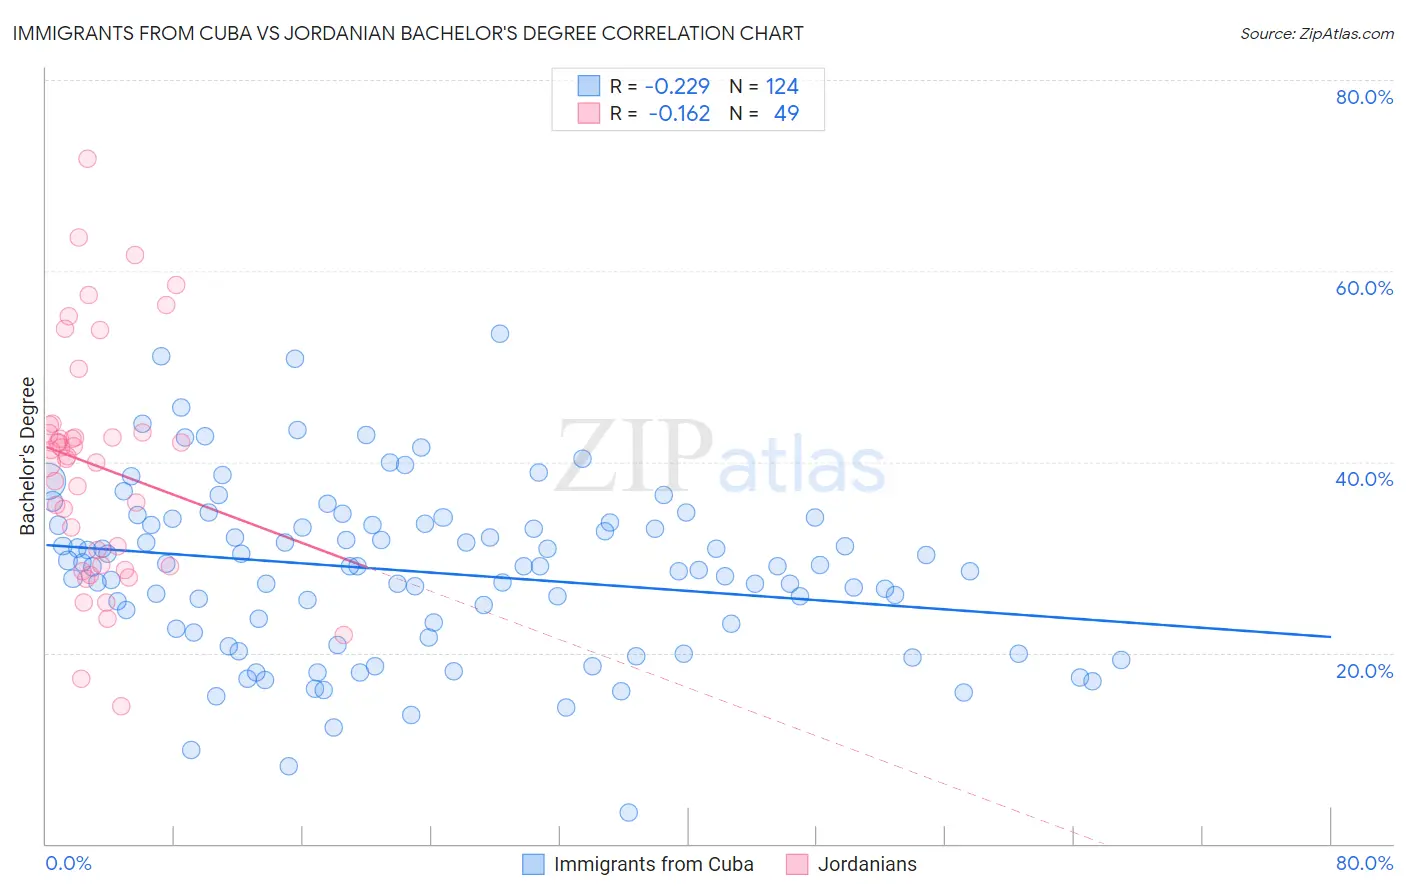
Immigrants from Cuba vs Jordanian Bachelor's Degree Correlation Chart
The statistical analysis conducted on geographies consisting of 325,960,947 people shows a weak negative correlation between the proportion of Immigrants from Cuba and percentage of population with at least bachelor's degree education in the United States with a correlation coefficient (R) of -0.229 and weighted average of 30.3%. Similarly, the statistical analysis conducted on geographies consisting of 166,421,482 people shows a poor negative correlation between the proportion of Jordanians and percentage of population with at least bachelor's degree education in the United States with a correlation coefficient (R) of -0.162 and weighted average of 41.2%, a difference of 35.7%.
Bachelor's Degree Correlation Summary
| Measurement | Immigrants from Cuba | Jordanian |
| Minimum | 3.3% | 14.4% |
| Maximum | 53.5% | 71.8% |
| Range | 50.2% | 57.4% |
| Mean | 28.5% | 39.6% |
| Median | 29.1% | 40.5% |
| Interquartile 25% (IQ1) | 22.3% | 29.1% |
| Interquartile 75% (IQ3) | 33.4% | 43.4% |
| Interquartile Range (IQR) | 11.1% | 14.3% |
| Standard Deviation (Sample) | 8.9% | 12.2% |
| Standard Deviation (Population) | 8.9% | 12.1% |
Similar Demographics by Bachelor's Degree
Demographics Similar to Immigrants from Cuba by Bachelor's Degree
In terms of bachelor's degree, the demographic groups most similar to Immigrants from Cuba are Immigrants from Micronesia (30.4%, a difference of 0.22%), Chickasaw (30.4%, a difference of 0.23%), Mexican American Indian (30.2%, a difference of 0.28%), Bangladeshi (30.2%, a difference of 0.45%), and Cherokee (30.2%, a difference of 0.45%).
| Demographics | Rating | Rank | Bachelor's Degree |
| Immigrants | Guatemala | 0.0 /100 | #294 | Tragic 30.8% |
| Immigrants | Dominican Republic | 0.0 /100 | #295 | Tragic 30.7% |
| Puget Sound Salish | 0.0 /100 | #296 | Tragic 30.7% |
| Immigrants | Haiti | 0.0 /100 | #297 | Tragic 30.6% |
| Chippewa | 0.0 /100 | #298 | Tragic 30.6% |
| Chickasaw | 0.0 /100 | #299 | Tragic 30.4% |
| Immigrants | Micronesia | 0.0 /100 | #300 | Tragic 30.4% |
| Immigrants | Cuba | 0.0 /100 | #301 | Tragic 30.3% |
| Mexican American Indians | 0.0 /100 | #302 | Tragic 30.2% |
| Bangladeshis | 0.0 /100 | #303 | Tragic 30.2% |
| Cherokee | 0.0 /100 | #304 | Tragic 30.2% |
| Immigrants | Latin America | 0.0 /100 | #305 | Tragic 30.1% |
| Immigrants | Yemen | 0.0 /100 | #306 | Tragic 29.9% |
| Nepalese | 0.0 /100 | #307 | Tragic 29.9% |
| Cajuns | 0.0 /100 | #308 | Tragic 29.6% |
Demographics Similar to Jordanians by Bachelor's Degree
In terms of bachelor's degree, the demographic groups most similar to Jordanians are Syrian (41.1%, a difference of 0.030%), Chilean (41.2%, a difference of 0.060%), Alsatian (41.0%, a difference of 0.29%), Immigrants from Italy (41.3%, a difference of 0.40%), and Northern European (41.0%, a difference of 0.46%).
| Demographics | Rating | Rank | Bachelor's Degree |
| Romanians | 98.4 /100 | #97 | Exceptional 41.6% |
| Immigrants | Ukraine | 98.3 /100 | #98 | Exceptional 41.5% |
| Immigrants | England | 98.1 /100 | #99 | Exceptional 41.4% |
| Macedonians | 98.1 /100 | #100 | Exceptional 41.4% |
| Immigrants | Morocco | 98.0 /100 | #101 | Exceptional 41.4% |
| Immigrants | Italy | 97.8 /100 | #102 | Exceptional 41.3% |
| Chileans | 97.5 /100 | #103 | Exceptional 41.2% |
| Jordanians | 97.4 /100 | #104 | Exceptional 41.2% |
| Syrians | 97.4 /100 | #105 | Exceptional 41.1% |
| Alsatians | 97.0 /100 | #106 | Exceptional 41.0% |
| Northern Europeans | 96.8 /100 | #107 | Exceptional 41.0% |
| Ukrainians | 96.6 /100 | #108 | Exceptional 40.9% |
| Arabs | 96.6 /100 | #109 | Exceptional 40.9% |
| Albanians | 96.5 /100 | #110 | Exceptional 40.9% |
| Immigrants | Chile | 96.4 /100 | #111 | Exceptional 40.8% |