Immigrants from North America vs Tongan Bachelor's Degree
COMPARE
Immigrants from North America
Tongan
Bachelor's Degree
Bachelor's Degree Comparison
Immigrants from North America
Tongans
41.7%
BACHELOR'S DEGREE
98.5/ 100
METRIC RATING
95th/ 347
METRIC RANK
34.3%
BACHELOR'S DEGREE
2.0/ 100
METRIC RATING
240th/ 347
METRIC RANK
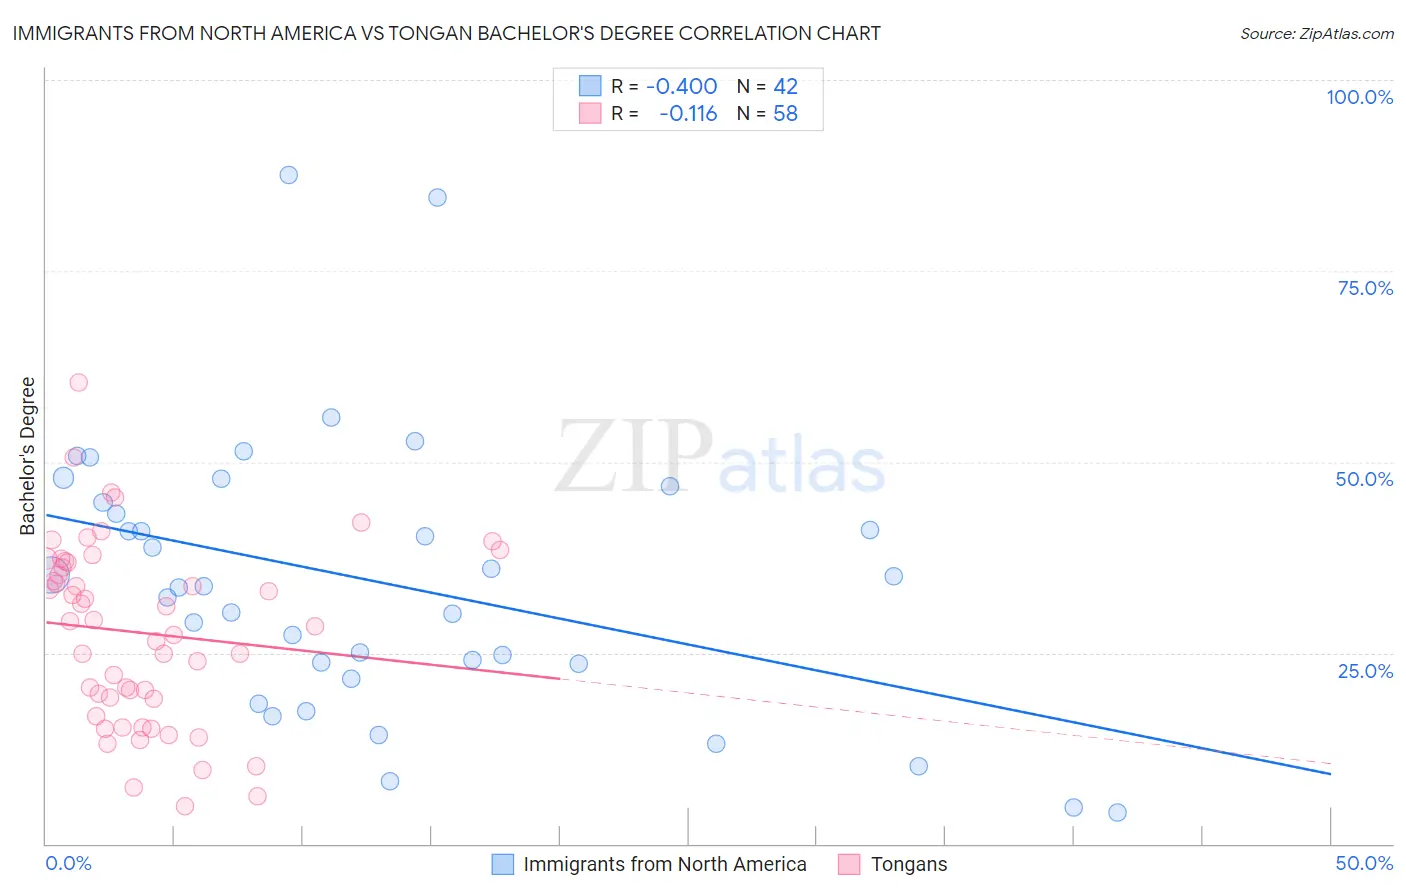
Immigrants from North America vs Tongan Bachelor's Degree Correlation Chart
The statistical analysis conducted on geographies consisting of 462,429,202 people shows a mild negative correlation between the proportion of Immigrants from North America and percentage of population with at least bachelor's degree education in the United States with a correlation coefficient (R) of -0.400 and weighted average of 41.7%. Similarly, the statistical analysis conducted on geographies consisting of 102,908,079 people shows a poor negative correlation between the proportion of Tongans and percentage of population with at least bachelor's degree education in the United States with a correlation coefficient (R) of -0.116 and weighted average of 34.3%, a difference of 21.6%.
Bachelor's Degree Correlation Summary
| Measurement | Immigrants from North America | Tongan |
| Minimum | 4.2% | 4.8% |
| Maximum | 87.6% | 60.4% |
| Range | 83.5% | 55.6% |
| Mean | 34.2% | 27.6% |
| Median | 33.6% | 28.7% |
| Interquartile 25% (IQ1) | 23.5% | 19.0% |
| Interquartile 75% (IQ3) | 44.7% | 36.8% |
| Interquartile Range (IQR) | 21.2% | 17.8% |
| Standard Deviation (Sample) | 18.1% | 11.9% |
| Standard Deviation (Population) | 17.9% | 11.8% |
Similar Demographics by Bachelor's Degree
Demographics Similar to Immigrants from North America by Bachelor's Degree
In terms of bachelor's degree, the demographic groups most similar to Immigrants from North America are Immigrants from Moldova (41.6%, a difference of 0.11%), Immigrants from Nepal (41.7%, a difference of 0.12%), Immigrants from Canada (41.7%, a difference of 0.15%), Romanian (41.6%, a difference of 0.16%), and Immigrants from Ukraine (41.5%, a difference of 0.27%).
| Demographics | Rating | Rank | Bachelor's Degree |
| Immigrants | Western Europe | 99.0 /100 | #88 | Exceptional 42.0% |
| Greeks | 99.0 /100 | #89 | Exceptional 42.0% |
| Laotians | 98.9 /100 | #90 | Exceptional 42.0% |
| Immigrants | Northern Africa | 98.9 /100 | #91 | Exceptional 41.9% |
| Maltese | 98.8 /100 | #92 | Exceptional 41.9% |
| Immigrants | Canada | 98.6 /100 | #93 | Exceptional 41.7% |
| Immigrants | Nepal | 98.6 /100 | #94 | Exceptional 41.7% |
| Immigrants | North America | 98.5 /100 | #95 | Exceptional 41.7% |
| Immigrants | Moldova | 98.4 /100 | #96 | Exceptional 41.6% |
| Romanians | 98.4 /100 | #97 | Exceptional 41.6% |
| Immigrants | Ukraine | 98.3 /100 | #98 | Exceptional 41.5% |
| Immigrants | England | 98.1 /100 | #99 | Exceptional 41.4% |
| Macedonians | 98.1 /100 | #100 | Exceptional 41.4% |
| Immigrants | Morocco | 98.0 /100 | #101 | Exceptional 41.4% |
| Immigrants | Italy | 97.8 /100 | #102 | Exceptional 41.3% |
Demographics Similar to Tongans by Bachelor's Degree
In terms of bachelor's degree, the demographic groups most similar to Tongans are Immigrants from Cambodia (34.2%, a difference of 0.26%), Nonimmigrants (34.2%, a difference of 0.33%), British West Indian (34.5%, a difference of 0.54%), Guyanese (34.5%, a difference of 0.56%), and Tlingit-Haida (34.6%, a difference of 0.84%).
| Demographics | Rating | Rank | Bachelor's Degree |
| Immigrants | Ecuador | 3.3 /100 | #233 | Tragic 34.7% |
| Guamanians/Chamorros | 3.0 /100 | #234 | Tragic 34.6% |
| Immigrants | West Indies | 2.9 /100 | #235 | Tragic 34.6% |
| Liberians | 2.8 /100 | #236 | Tragic 34.6% |
| Tlingit-Haida | 2.8 /100 | #237 | Tragic 34.6% |
| Guyanese | 2.5 /100 | #238 | Tragic 34.5% |
| British West Indians | 2.5 /100 | #239 | Tragic 34.5% |
| Tongans | 2.0 /100 | #240 | Tragic 34.3% |
| Immigrants | Cambodia | 1.9 /100 | #241 | Tragic 34.2% |
| Immigrants | Nonimmigrants | 1.8 /100 | #242 | Tragic 34.2% |
| Immigrants | Guyana | 1.4 /100 | #243 | Tragic 33.9% |
| Delaware | 1.2 /100 | #244 | Tragic 33.8% |
| Immigrants | Fiji | 1.2 /100 | #245 | Tragic 33.7% |
| Jamaicans | 1.0 /100 | #246 | Tragic 33.6% |
| Immigrants | Congo | 1.0 /100 | #247 | Tragic 33.6% |