Immigrants from North America vs Zimbabwean Bachelor's Degree
COMPARE
Immigrants from North America
Zimbabwean
Bachelor's Degree
Bachelor's Degree Comparison
Immigrants from North America
Zimbabweans
41.7%
BACHELOR'S DEGREE
98.5/ 100
METRIC RATING
95th/ 347
METRIC RANK
43.3%
BACHELOR'S DEGREE
99.7/ 100
METRIC RATING
65th/ 347
METRIC RANK
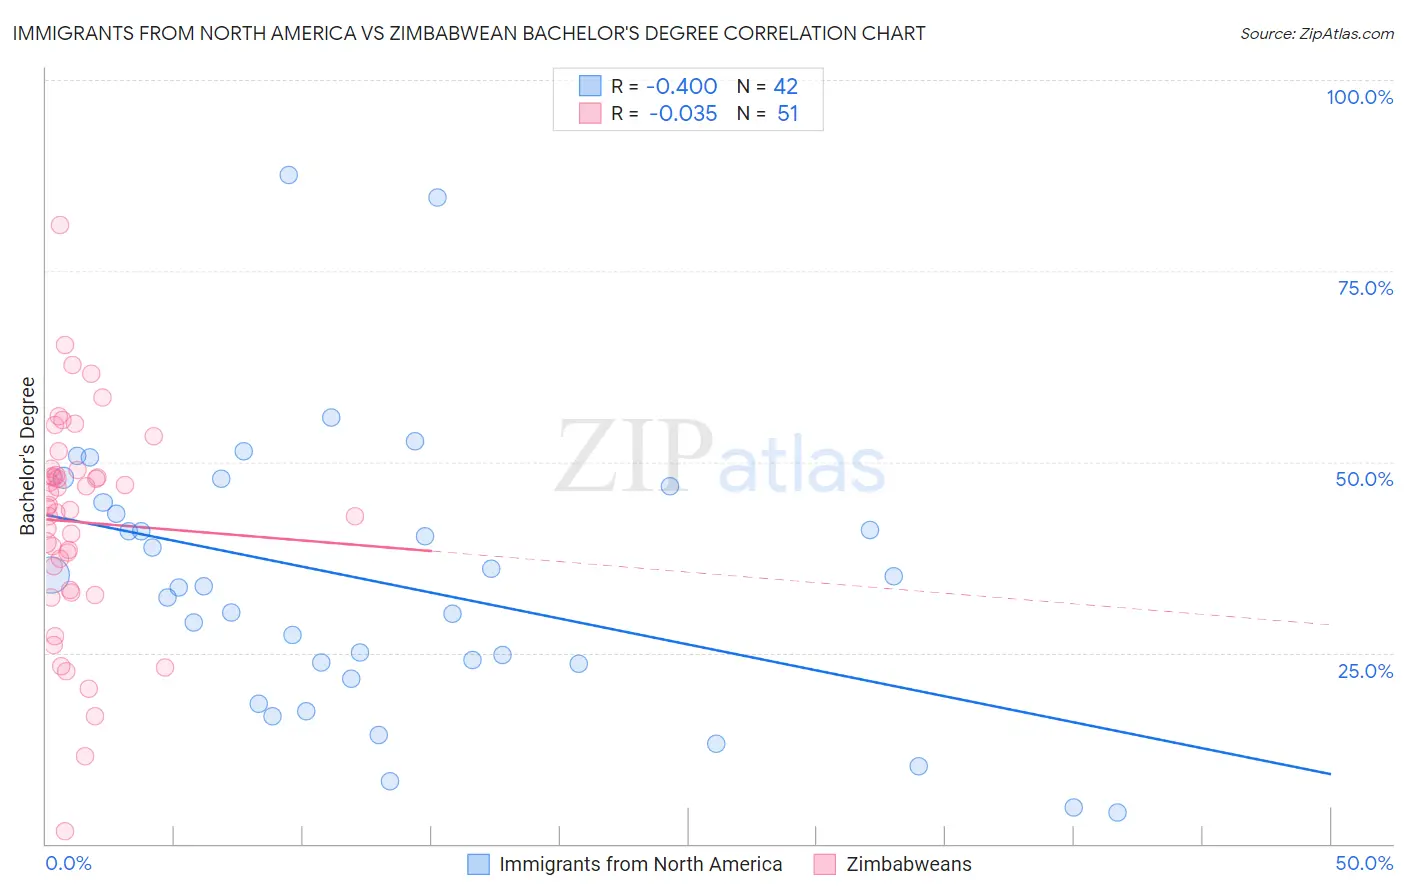
Immigrants from North America vs Zimbabwean Bachelor's Degree Correlation Chart
The statistical analysis conducted on geographies consisting of 462,429,202 people shows a mild negative correlation between the proportion of Immigrants from North America and percentage of population with at least bachelor's degree education in the United States with a correlation coefficient (R) of -0.400 and weighted average of 41.7%. Similarly, the statistical analysis conducted on geographies consisting of 69,203,243 people shows no correlation between the proportion of Zimbabweans and percentage of population with at least bachelor's degree education in the United States with a correlation coefficient (R) of -0.035 and weighted average of 43.3%, a difference of 3.9%.
Bachelor's Degree Correlation Summary
| Measurement | Immigrants from North America | Zimbabwean |
| Minimum | 4.2% | 1.7% |
| Maximum | 87.6% | 81.0% |
| Range | 83.5% | 79.3% |
| Mean | 34.2% | 42.1% |
| Median | 33.6% | 44.0% |
| Interquartile 25% (IQ1) | 23.5% | 33.2% |
| Interquartile 75% (IQ3) | 44.7% | 49.0% |
| Interquartile Range (IQR) | 21.2% | 15.8% |
| Standard Deviation (Sample) | 18.1% | 14.3% |
| Standard Deviation (Population) | 17.9% | 14.1% |
Similar Demographics by Bachelor's Degree
Demographics Similar to Immigrants from North America by Bachelor's Degree
In terms of bachelor's degree, the demographic groups most similar to Immigrants from North America are Immigrants from Moldova (41.6%, a difference of 0.11%), Immigrants from Nepal (41.7%, a difference of 0.12%), Immigrants from Canada (41.7%, a difference of 0.15%), Romanian (41.6%, a difference of 0.16%), and Immigrants from Ukraine (41.5%, a difference of 0.27%).
| Demographics | Rating | Rank | Bachelor's Degree |
| Immigrants | Western Europe | 99.0 /100 | #88 | Exceptional 42.0% |
| Greeks | 99.0 /100 | #89 | Exceptional 42.0% |
| Laotians | 98.9 /100 | #90 | Exceptional 42.0% |
| Immigrants | Northern Africa | 98.9 /100 | #91 | Exceptional 41.9% |
| Maltese | 98.8 /100 | #92 | Exceptional 41.9% |
| Immigrants | Canada | 98.6 /100 | #93 | Exceptional 41.7% |
| Immigrants | Nepal | 98.6 /100 | #94 | Exceptional 41.7% |
| Immigrants | North America | 98.5 /100 | #95 | Exceptional 41.7% |
| Immigrants | Moldova | 98.4 /100 | #96 | Exceptional 41.6% |
| Romanians | 98.4 /100 | #97 | Exceptional 41.6% |
| Immigrants | Ukraine | 98.3 /100 | #98 | Exceptional 41.5% |
| Immigrants | England | 98.1 /100 | #99 | Exceptional 41.4% |
| Macedonians | 98.1 /100 | #100 | Exceptional 41.4% |
| Immigrants | Morocco | 98.0 /100 | #101 | Exceptional 41.4% |
| Immigrants | Italy | 97.8 /100 | #102 | Exceptional 41.3% |
Demographics Similar to Zimbabweans by Bachelor's Degree
In terms of bachelor's degree, the demographic groups most similar to Zimbabweans are Argentinean (43.3%, a difference of 0.0%), Immigrants from Netherlands (43.3%, a difference of 0.020%), Egyptian (43.3%, a difference of 0.040%), Immigrants from Indonesia (43.3%, a difference of 0.060%), and Immigrants from Europe (43.4%, a difference of 0.28%).
| Demographics | Rating | Rank | Bachelor's Degree |
| Immigrants | Czechoslovakia | 99.9 /100 | #58 | Exceptional 44.0% |
| Australians | 99.9 /100 | #59 | Exceptional 44.0% |
| New Zealanders | 99.9 /100 | #60 | Exceptional 44.0% |
| South Africans | 99.8 /100 | #61 | Exceptional 43.6% |
| Immigrants | Kazakhstan | 99.8 /100 | #62 | Exceptional 43.4% |
| Immigrants | Europe | 99.8 /100 | #63 | Exceptional 43.4% |
| Argentineans | 99.7 /100 | #64 | Exceptional 43.3% |
| Zimbabweans | 99.7 /100 | #65 | Exceptional 43.3% |
| Immigrants | Netherlands | 99.7 /100 | #66 | Exceptional 43.3% |
| Egyptians | 99.7 /100 | #67 | Exceptional 43.3% |
| Immigrants | Indonesia | 99.7 /100 | #68 | Exceptional 43.3% |
| Immigrants | Pakistan | 99.7 /100 | #69 | Exceptional 43.1% |
| Immigrants | Romania | 99.6 /100 | #70 | Exceptional 42.9% |
| Immigrants | Argentina | 99.6 /100 | #71 | Exceptional 42.8% |
| Ethiopians | 99.5 /100 | #72 | Exceptional 42.8% |