Bermudan vs South American Doctorate Degree
COMPARE
Bermudan
South American
Doctorate Degree
Doctorate Degree Comparison
Bermudans
South Americans
1.8%
DOCTORATE DEGREE
52.1/ 100
METRIC RATING
171st/ 347
METRIC RANK
1.8%
DOCTORATE DEGREE
29.5/ 100
METRIC RATING
191st/ 347
METRIC RANK
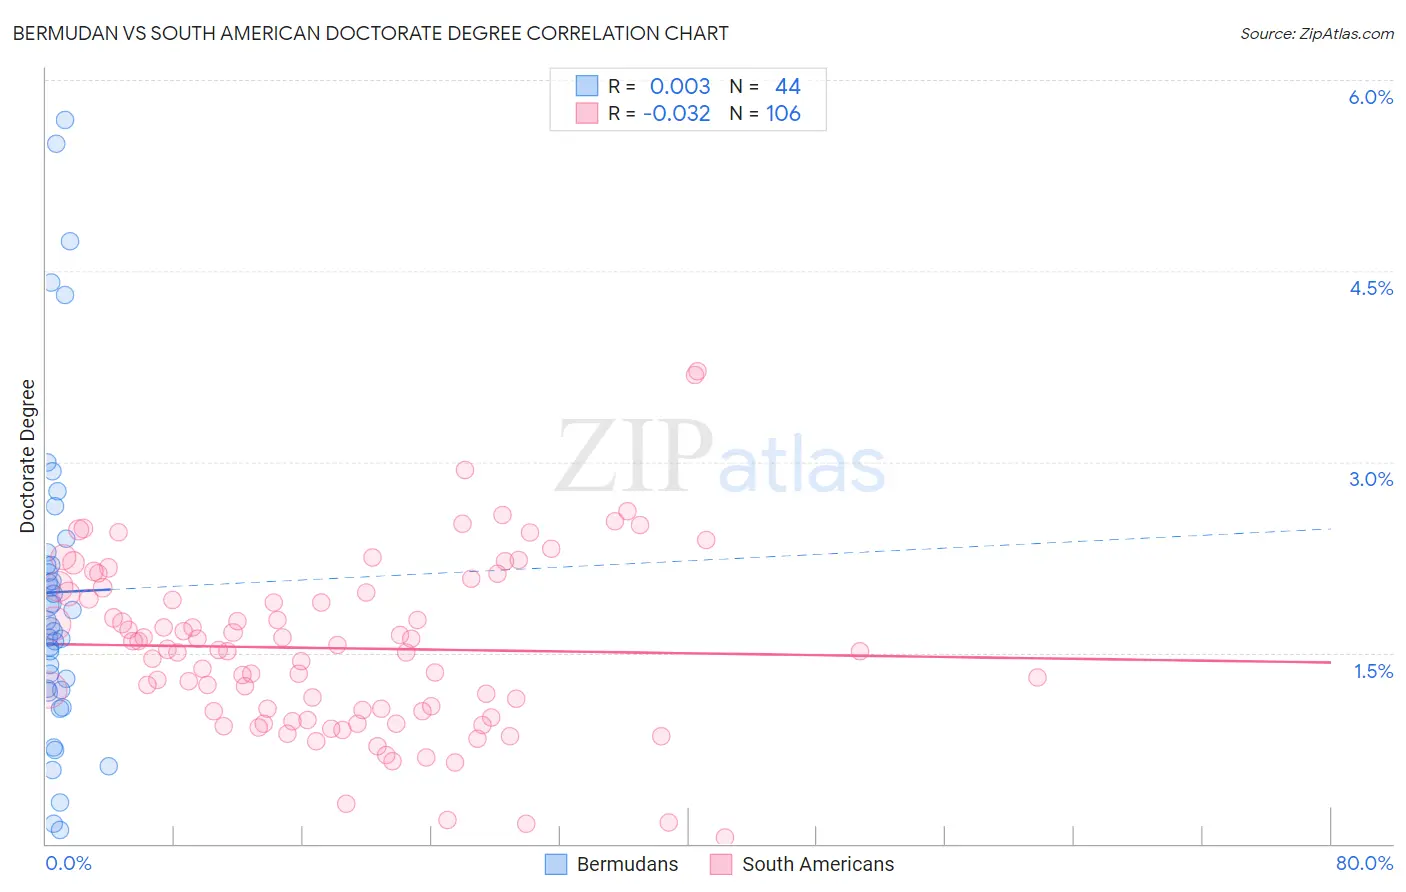
Bermudan vs South American Doctorate Degree Correlation Chart
The statistical analysis conducted on geographies consisting of 55,683,142 people shows no correlation between the proportion of Bermudans and percentage of population with at least doctorate degree education in the United States with a correlation coefficient (R) of 0.003 and weighted average of 1.8%. Similarly, the statistical analysis conducted on geographies consisting of 486,603,366 people shows no correlation between the proportion of South Americans and percentage of population with at least doctorate degree education in the United States with a correlation coefficient (R) of -0.032 and weighted average of 1.8%, a difference of 3.6%.
Doctorate Degree Correlation Summary
| Measurement | Bermudan | South American |
| Minimum | 0.10% | 0.049% |
| Maximum | 5.7% | 3.7% |
| Range | 5.6% | 3.7% |
| Mean | 2.0% | 1.5% |
| Median | 1.7% | 1.5% |
| Interquartile 25% (IQ1) | 1.2% | 1.0% |
| Interquartile 75% (IQ3) | 2.2% | 2.0% |
| Interquartile Range (IQR) | 1.0% | 0.93% |
| Standard Deviation (Sample) | 1.3% | 0.68% |
| Standard Deviation (Population) | 1.3% | 0.68% |
Demographics Similar to Bermudans and South Americans by Doctorate Degree
In terms of doctorate degree, the demographic groups most similar to Bermudans are Belgian (1.8%, a difference of 0.27%), Norwegian (1.8%, a difference of 0.31%), Immigrants from Bangladesh (1.8%, a difference of 0.31%), Immigrants from Thailand (1.8%, a difference of 0.40%), and Spanish (1.8%, a difference of 0.41%). Similarly, the demographic groups most similar to South Americans are Immigrants from Costa Rica (1.8%, a difference of 0.12%), French Canadian (1.8%, a difference of 0.13%), German (1.8%, a difference of 0.18%), Czechoslovakian (1.8%, a difference of 0.62%), and Peruvian (1.8%, a difference of 0.85%).
| Demographics | Rating | Rank | Doctorate Degree |
| Bermudans | 52.1 /100 | #171 | Average 1.8% |
| Belgians | 50.3 /100 | #172 | Average 1.8% |
| Norwegians | 50.0 /100 | #173 | Average 1.8% |
| Immigrants | Bangladesh | 50.0 /100 | #174 | Average 1.8% |
| Immigrants | Thailand | 49.4 /100 | #175 | Average 1.8% |
| Spanish | 49.3 /100 | #176 | Average 1.8% |
| Iraqis | 49.2 /100 | #177 | Average 1.8% |
| French | 48.8 /100 | #178 | Average 1.8% |
| Ghanaians | 48.3 /100 | #179 | Average 1.8% |
| Scandinavians | 48.0 /100 | #180 | Average 1.8% |
| Immigrants | Immigrants | 46.2 /100 | #181 | Average 1.8% |
| Immigrants | Afghanistan | 44.3 /100 | #182 | Average 1.8% |
| Finns | 42.1 /100 | #183 | Average 1.8% |
| Nigerians | 39.9 /100 | #184 | Fair 1.8% |
| Slovaks | 36.4 /100 | #185 | Fair 1.8% |
| Peruvians | 34.4 /100 | #186 | Fair 1.8% |
| Czechoslovakians | 33.0 /100 | #187 | Fair 1.8% |
| Germans | 30.5 /100 | #188 | Fair 1.8% |
| French Canadians | 30.2 /100 | #189 | Fair 1.8% |
| Immigrants | Costa Rica | 30.2 /100 | #190 | Fair 1.8% |
| South Americans | 29.5 /100 | #191 | Fair 1.8% |