Immigrants from Nigeria vs Slovene Master's Degree
COMPARE
Immigrants from Nigeria
Slovene
Master's Degree
Master's Degree Comparison
Immigrants from Nigeria
Slovenes
14.6%
MASTER'S DEGREE
32.7/ 100
METRIC RATING
193rd/ 347
METRIC RANK
15.5%
MASTER'S DEGREE
78.0/ 100
METRIC RATING
150th/ 347
METRIC RANK
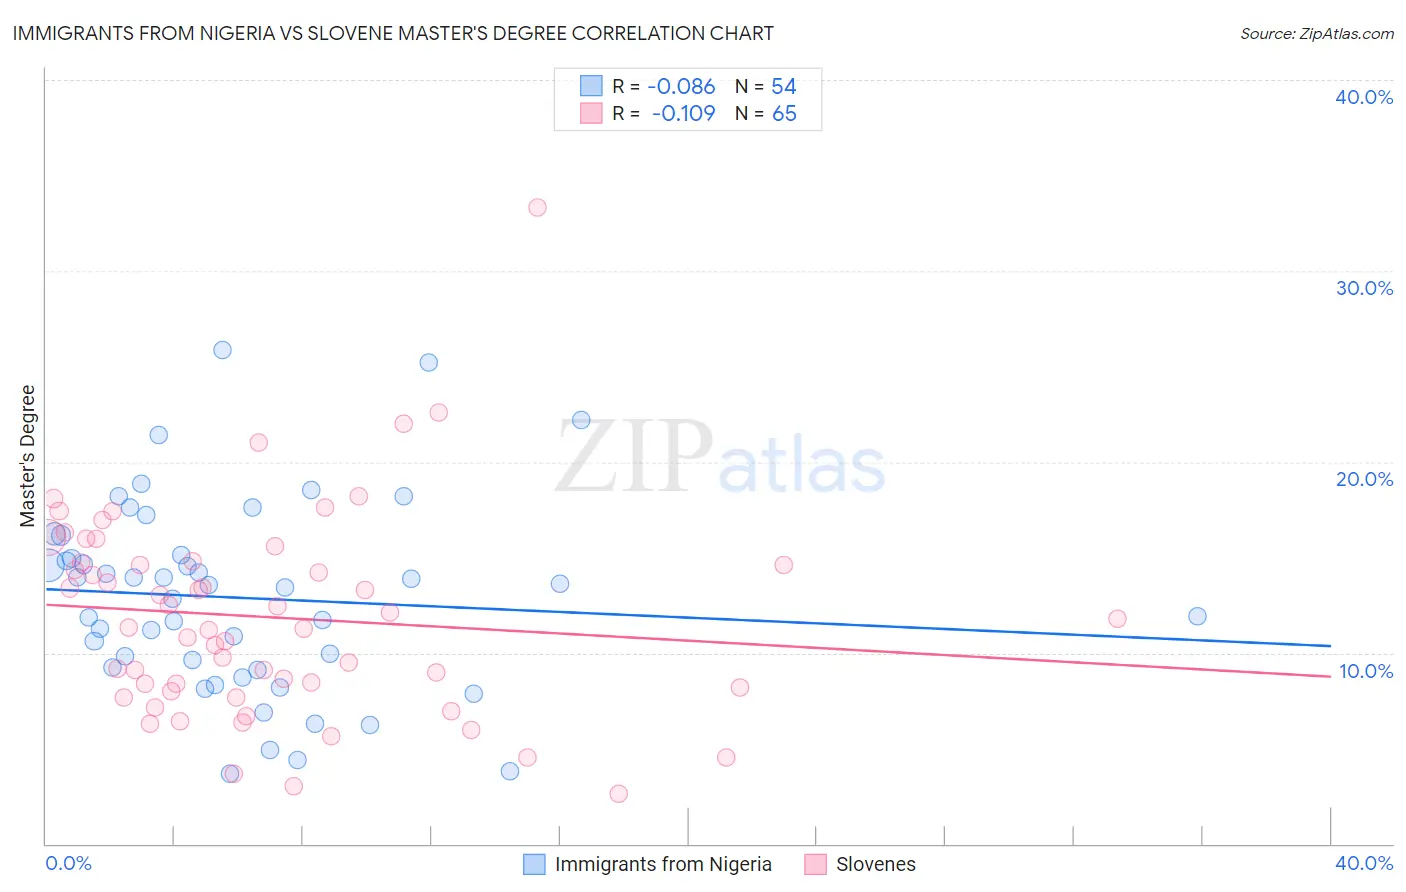
Immigrants from Nigeria vs Slovene Master's Degree Correlation Chart
The statistical analysis conducted on geographies consisting of 283,420,581 people shows a slight negative correlation between the proportion of Immigrants from Nigeria and percentage of population with at least master's degree education in the United States with a correlation coefficient (R) of -0.086 and weighted average of 14.6%. Similarly, the statistical analysis conducted on geographies consisting of 261,310,088 people shows a poor negative correlation between the proportion of Slovenes and percentage of population with at least master's degree education in the United States with a correlation coefficient (R) of -0.109 and weighted average of 15.5%, a difference of 6.5%.
Master's Degree Correlation Summary
| Measurement | Immigrants from Nigeria | Slovene |
| Minimum | 3.7% | 2.6% |
| Maximum | 25.9% | 33.3% |
| Range | 22.2% | 30.7% |
| Mean | 12.9% | 11.9% |
| Median | 13.5% | 11.3% |
| Interquartile 25% (IQ1) | 9.2% | 8.1% |
| Interquartile 75% (IQ3) | 15.1% | 14.8% |
| Interquartile Range (IQR) | 5.9% | 6.7% |
| Standard Deviation (Sample) | 5.0% | 5.4% |
| Standard Deviation (Population) | 5.0% | 5.3% |
Similar Demographics by Master's Degree
Demographics Similar to Immigrants from Nigeria by Master's Degree
In terms of master's degree, the demographic groups most similar to Immigrants from Nigeria are Chinese (14.6%, a difference of 0.040%), Immigrants from Middle Africa (14.6%, a difference of 0.13%), Welsh (14.6%, a difference of 0.22%), Danish (14.5%, a difference of 0.22%), and Czechoslovakian (14.5%, a difference of 0.43%).
| Demographics | Rating | Rank | Master's Degree |
| Immigrants | Oceania | 37.1 /100 | #186 | Fair 14.7% |
| Basques | 36.5 /100 | #187 | Fair 14.7% |
| Immigrants | Costa Rica | 36.2 /100 | #188 | Fair 14.7% |
| Immigrants | Immigrants | 36.0 /100 | #189 | Fair 14.6% |
| Spaniards | 35.8 /100 | #190 | Fair 14.6% |
| Welsh | 34.2 /100 | #191 | Fair 14.6% |
| Immigrants | Middle Africa | 33.6 /100 | #192 | Fair 14.6% |
| Immigrants | Nigeria | 32.7 /100 | #193 | Fair 14.6% |
| Chinese | 32.5 /100 | #194 | Fair 14.6% |
| Danes | 31.3 /100 | #195 | Fair 14.5% |
| Czechoslovakians | 29.9 /100 | #196 | Fair 14.5% |
| Belgians | 28.0 /100 | #197 | Fair 14.5% |
| West Indians | 27.4 /100 | #198 | Fair 14.5% |
| Immigrants | Armenia | 27.2 /100 | #199 | Fair 14.5% |
| Panamanians | 25.1 /100 | #200 | Fair 14.4% |
Demographics Similar to Slovenes by Master's Degree
In terms of master's degree, the demographic groups most similar to Slovenes are Ghanaian (15.5%, a difference of 0.030%), Immigrants from Senegal (15.5%, a difference of 0.040%), Iraqi (15.5%, a difference of 0.12%), Slavic (15.5%, a difference of 0.17%), and Icelander (15.5%, a difference of 0.20%).
| Demographics | Rating | Rank | Master's Degree |
| Immigrants | Venezuela | 83.6 /100 | #143 | Excellent 15.7% |
| Canadians | 83.3 /100 | #144 | Excellent 15.7% |
| South Americans | 81.3 /100 | #145 | Excellent 15.6% |
| Immigrants | Afghanistan | 79.4 /100 | #146 | Good 15.6% |
| Hungarians | 79.1 /100 | #147 | Good 15.6% |
| Immigrants | Senegal | 78.2 /100 | #148 | Good 15.5% |
| Ghanaians | 78.2 /100 | #149 | Good 15.5% |
| Slovenes | 78.0 /100 | #150 | Good 15.5% |
| Iraqis | 77.3 /100 | #151 | Good 15.5% |
| Slavs | 77.0 /100 | #152 | Good 15.5% |
| Icelanders | 76.8 /100 | #153 | Good 15.5% |
| Immigrants | South America | 76.3 /100 | #154 | Good 15.5% |
| Immigrants | Bangladesh | 76.1 /100 | #155 | Good 15.5% |
| Bermudans | 73.9 /100 | #156 | Good 15.4% |
| Immigrants | Cameroon | 71.7 /100 | #157 | Good 15.4% |