Bulgarian vs Slovene Master's Degree
COMPARE
Bulgarian
Slovene
Master's Degree
Master's Degree Comparison
Bulgarians
Slovenes
18.8%
MASTER'S DEGREE
100.0/ 100
METRIC RATING
50th/ 347
METRIC RANK
15.5%
MASTER'S DEGREE
78.0/ 100
METRIC RATING
150th/ 347
METRIC RANK
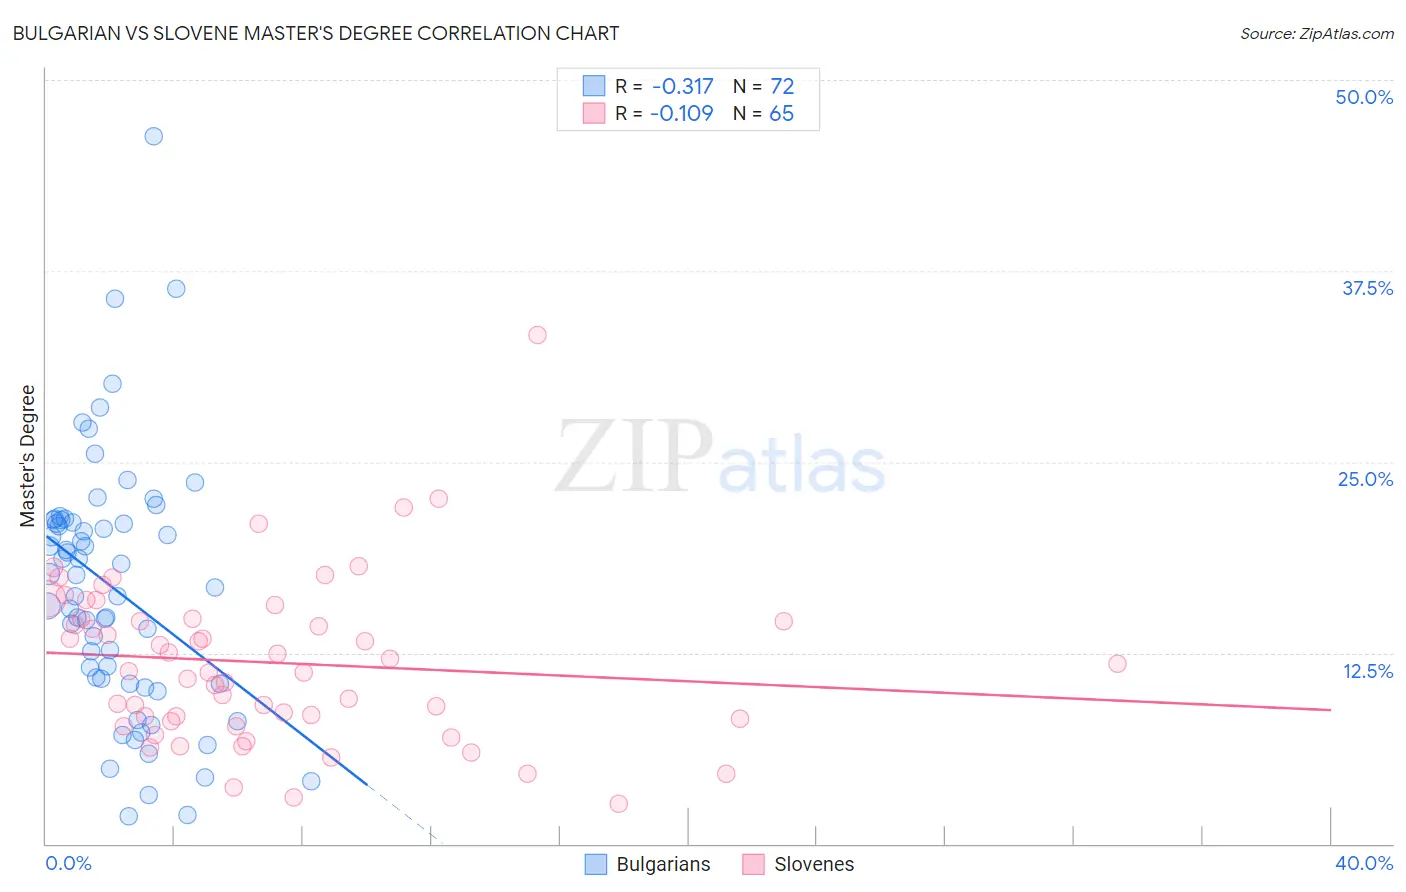
Bulgarian vs Slovene Master's Degree Correlation Chart
The statistical analysis conducted on geographies consisting of 205,591,570 people shows a mild negative correlation between the proportion of Bulgarians and percentage of population with at least master's degree education in the United States with a correlation coefficient (R) of -0.317 and weighted average of 18.8%. Similarly, the statistical analysis conducted on geographies consisting of 261,310,088 people shows a poor negative correlation between the proportion of Slovenes and percentage of population with at least master's degree education in the United States with a correlation coefficient (R) of -0.109 and weighted average of 15.5%, a difference of 20.8%.
Master's Degree Correlation Summary
| Measurement | Bulgarian | Slovene |
| Minimum | 1.8% | 2.6% |
| Maximum | 46.3% | 33.3% |
| Range | 44.5% | 30.7% |
| Mean | 16.7% | 11.9% |
| Median | 17.2% | 11.3% |
| Interquartile 25% (IQ1) | 10.6% | 8.1% |
| Interquartile 75% (IQ3) | 21.1% | 14.8% |
| Interquartile Range (IQR) | 10.4% | 6.7% |
| Standard Deviation (Sample) | 8.3% | 5.4% |
| Standard Deviation (Population) | 8.2% | 5.3% |
Similar Demographics by Master's Degree
Demographics Similar to Bulgarians by Master's Degree
In terms of master's degree, the demographic groups most similar to Bulgarians are Immigrants from South Africa (18.8%, a difference of 0.010%), Estonian (18.8%, a difference of 0.19%), Paraguayan (18.8%, a difference of 0.28%), Immigrants from Austria (18.8%, a difference of 0.34%), and Immigrants from Norway (18.8%, a difference of 0.35%).
| Demographics | Rating | Rank | Master's Degree |
| Immigrants | Greece | 100.0 /100 | #43 | Exceptional 19.0% |
| Immigrants | Malaysia | 100.0 /100 | #44 | Exceptional 18.9% |
| Immigrants | Belarus | 100.0 /100 | #45 | Exceptional 18.9% |
| Immigrants | Norway | 100.0 /100 | #46 | Exceptional 18.8% |
| Immigrants | Austria | 100.0 /100 | #47 | Exceptional 18.8% |
| Paraguayans | 100.0 /100 | #48 | Exceptional 18.8% |
| Estonians | 100.0 /100 | #49 | Exceptional 18.8% |
| Bulgarians | 100.0 /100 | #50 | Exceptional 18.8% |
| Immigrants | South Africa | 100.0 /100 | #51 | Exceptional 18.8% |
| Immigrants | Kuwait | 100.0 /100 | #52 | Exceptional 18.6% |
| Immigrants | Czechoslovakia | 99.9 /100 | #53 | Exceptional 18.5% |
| Immigrants | Lithuania | 99.9 /100 | #54 | Exceptional 18.5% |
| Immigrants | Serbia | 99.9 /100 | #55 | Exceptional 18.5% |
| Asians | 99.9 /100 | #56 | Exceptional 18.4% |
| Immigrants | Asia | 99.9 /100 | #57 | Exceptional 18.4% |
Demographics Similar to Slovenes by Master's Degree
In terms of master's degree, the demographic groups most similar to Slovenes are Ghanaian (15.5%, a difference of 0.030%), Immigrants from Senegal (15.5%, a difference of 0.040%), Iraqi (15.5%, a difference of 0.12%), Slavic (15.5%, a difference of 0.17%), and Icelander (15.5%, a difference of 0.20%).
| Demographics | Rating | Rank | Master's Degree |
| Immigrants | Venezuela | 83.6 /100 | #143 | Excellent 15.7% |
| Canadians | 83.3 /100 | #144 | Excellent 15.7% |
| South Americans | 81.3 /100 | #145 | Excellent 15.6% |
| Immigrants | Afghanistan | 79.4 /100 | #146 | Good 15.6% |
| Hungarians | 79.1 /100 | #147 | Good 15.6% |
| Immigrants | Senegal | 78.2 /100 | #148 | Good 15.5% |
| Ghanaians | 78.2 /100 | #149 | Good 15.5% |
| Slovenes | 78.0 /100 | #150 | Good 15.5% |
| Iraqis | 77.3 /100 | #151 | Good 15.5% |
| Slavs | 77.0 /100 | #152 | Good 15.5% |
| Icelanders | 76.8 /100 | #153 | Good 15.5% |
| Immigrants | South America | 76.3 /100 | #154 | Good 15.5% |
| Immigrants | Bangladesh | 76.1 /100 | #155 | Good 15.5% |
| Bermudans | 73.9 /100 | #156 | Good 15.4% |
| Immigrants | Cameroon | 71.7 /100 | #157 | Good 15.4% |