Immigrants from Nigeria vs Slovene Unemployment Among Ages 60 to 64 years
COMPARE
Immigrants from Nigeria
Slovene
Unemployment Among Ages 60 to 64 years
Unemployment Among Ages 60 to 64 years Comparison
Immigrants from Nigeria
Slovenes
4.9%
UNEMPLOYMENT AMONG AGES 60 TO 64 YEARS
29.6/ 100
METRIC RATING
191st/ 347
METRIC RANK
4.4%
UNEMPLOYMENT AMONG AGES 60 TO 64 YEARS
100.0/ 100
METRIC RATING
18th/ 347
METRIC RANK
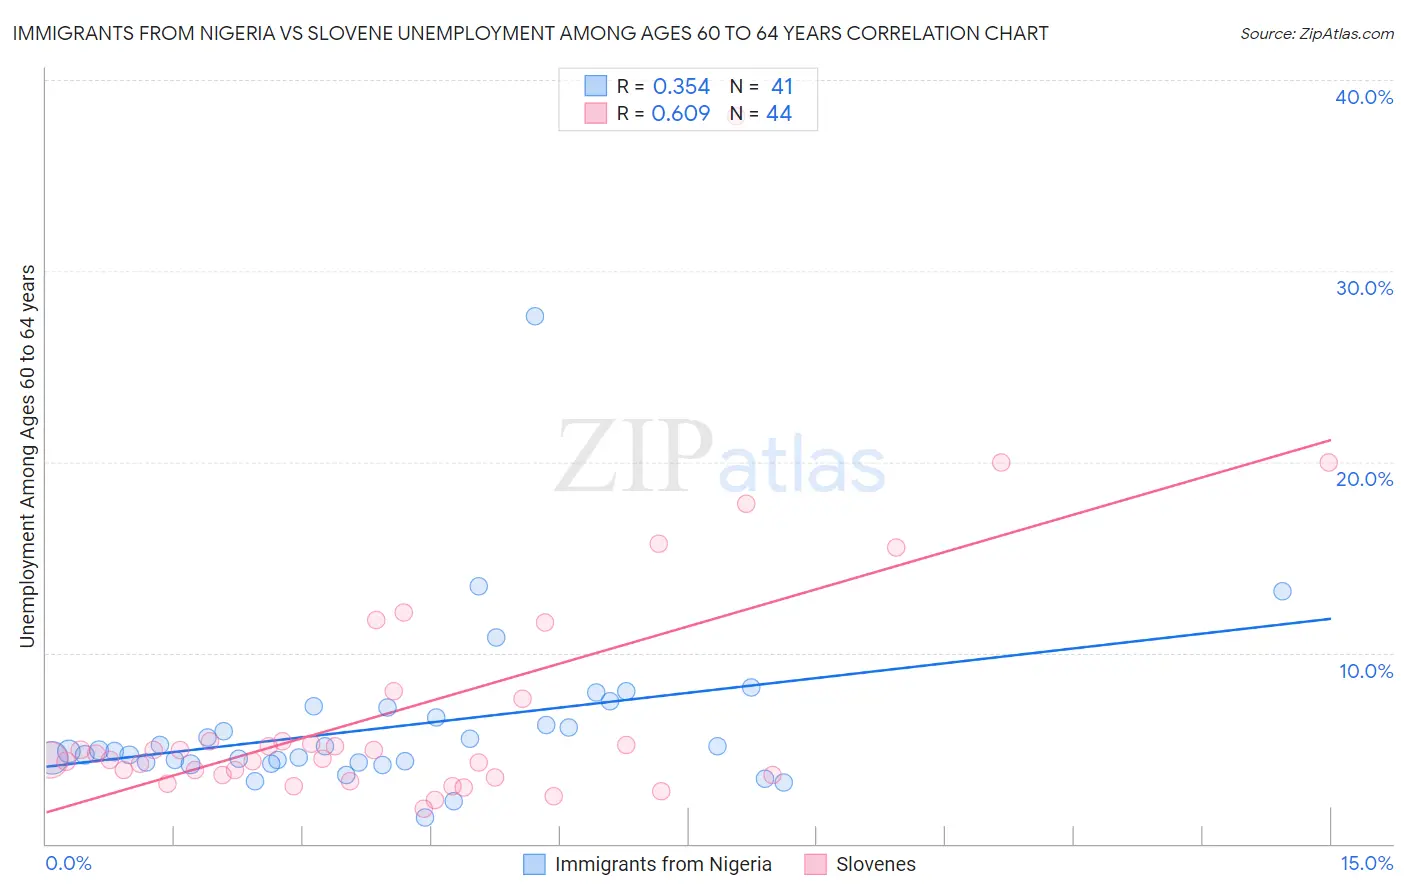
Immigrants from Nigeria vs Slovene Unemployment Among Ages 60 to 64 years Correlation Chart
The statistical analysis conducted on geographies consisting of 265,184,099 people shows a mild positive correlation between the proportion of Immigrants from Nigeria and unemployment rate among population between the ages 60 and 64 in the United States with a correlation coefficient (R) of 0.354 and weighted average of 4.9%. Similarly, the statistical analysis conducted on geographies consisting of 241,955,713 people shows a significant positive correlation between the proportion of Slovenes and unemployment rate among population between the ages 60 and 64 in the United States with a correlation coefficient (R) of 0.609 and weighted average of 4.4%, a difference of 11.7%.
Unemployment Among Ages 60 to 64 years Correlation Summary
| Measurement | Immigrants from Nigeria | Slovene |
| Minimum | 1.4% | 1.8% |
| Maximum | 27.6% | 38.1% |
| Range | 26.2% | 36.3% |
| Mean | 6.1% | 7.1% |
| Median | 4.8% | 4.6% |
| Interquartile 25% (IQ1) | 4.3% | 3.6% |
| Interquartile 75% (IQ3) | 6.9% | 6.5% |
| Interquartile Range (IQR) | 2.6% | 2.9% |
| Standard Deviation (Sample) | 4.2% | 6.8% |
| Standard Deviation (Population) | 4.2% | 6.7% |
Similar Demographics by Unemployment Among Ages 60 to 64 years
Demographics Similar to Immigrants from Nigeria by Unemployment Among Ages 60 to 64 years
In terms of unemployment among ages 60 to 64 years, the demographic groups most similar to Immigrants from Nigeria are Immigrants from Nicaragua (4.9%, a difference of 0.010%), Immigrants from Europe (4.9%, a difference of 0.010%), Nicaraguan (4.9%, a difference of 0.030%), Menominee (4.9%, a difference of 0.030%), and Houma (4.9%, a difference of 0.050%).
| Demographics | Rating | Rank | Unemployment Among Ages 60 to 64 years |
| Immigrants | Ukraine | 37.6 /100 | #184 | Fair 4.9% |
| Ute | 37.4 /100 | #185 | Fair 4.9% |
| Spaniards | 35.8 /100 | #186 | Fair 4.9% |
| South American Indians | 31.2 /100 | #187 | Fair 4.9% |
| Nicaraguans | 30.4 /100 | #188 | Fair 4.9% |
| Immigrants | Nicaragua | 29.8 /100 | #189 | Fair 4.9% |
| Immigrants | Europe | 29.8 /100 | #190 | Fair 4.9% |
| Immigrants | Nigeria | 29.6 /100 | #191 | Fair 4.9% |
| Menominee | 28.8 /100 | #192 | Fair 4.9% |
| Houma | 28.3 /100 | #193 | Fair 4.9% |
| Immigrants | Colombia | 26.8 /100 | #194 | Fair 4.9% |
| Immigrants | Austria | 26.6 /100 | #195 | Fair 4.9% |
| Immigrants | Asia | 25.7 /100 | #196 | Fair 4.9% |
| Immigrants | Eastern Europe | 25.2 /100 | #197 | Fair 4.9% |
| Guamanians/Chamorros | 23.7 /100 | #198 | Fair 4.9% |
Demographics Similar to Slovenes by Unemployment Among Ages 60 to 64 years
In terms of unemployment among ages 60 to 64 years, the demographic groups most similar to Slovenes are Tsimshian (4.4%, a difference of 0.11%), Afghan (4.4%, a difference of 0.25%), Immigrants from Cabo Verde (4.4%, a difference of 0.25%), Cape Verdean (4.4%, a difference of 0.33%), and Immigrants from Afghanistan (4.4%, a difference of 0.40%).
| Demographics | Rating | Rank | Unemployment Among Ages 60 to 64 years |
| Luxembourgers | 100.0 /100 | #11 | Exceptional 4.3% |
| Immigrants | Cuba | 100.0 /100 | #12 | Exceptional 4.3% |
| Chickasaw | 100.0 /100 | #13 | Exceptional 4.3% |
| Norwegians | 100.0 /100 | #14 | Exceptional 4.3% |
| Sudanese | 100.0 /100 | #15 | Exceptional 4.3% |
| Danes | 100.0 /100 | #16 | Exceptional 4.4% |
| Immigrants | Afghanistan | 100.0 /100 | #17 | Exceptional 4.4% |
| Slovenes | 100.0 /100 | #18 | Exceptional 4.4% |
| Tsimshian | 100.0 /100 | #19 | Exceptional 4.4% |
| Afghans | 100.0 /100 | #20 | Exceptional 4.4% |
| Immigrants | Cabo Verde | 100.0 /100 | #21 | Exceptional 4.4% |
| Cape Verdeans | 100.0 /100 | #22 | Exceptional 4.4% |
| Immigrants | Zaire | 100.0 /100 | #23 | Exceptional 4.4% |
| Immigrants | Burma/Myanmar | 100.0 /100 | #24 | Exceptional 4.4% |
| Yugoslavians | 100.0 /100 | #25 | Exceptional 4.4% |