Immigrants from Nigeria vs Costa Rican Master's Degree
COMPARE
Immigrants from Nigeria
Costa Rican
Master's Degree
Master's Degree Comparison
Immigrants from Nigeria
Costa Ricans
14.6%
MASTER'S DEGREE
32.7/ 100
METRIC RATING
193rd/ 347
METRIC RANK
15.0%
MASTER'S DEGREE
52.5/ 100
METRIC RATING
173rd/ 347
METRIC RANK
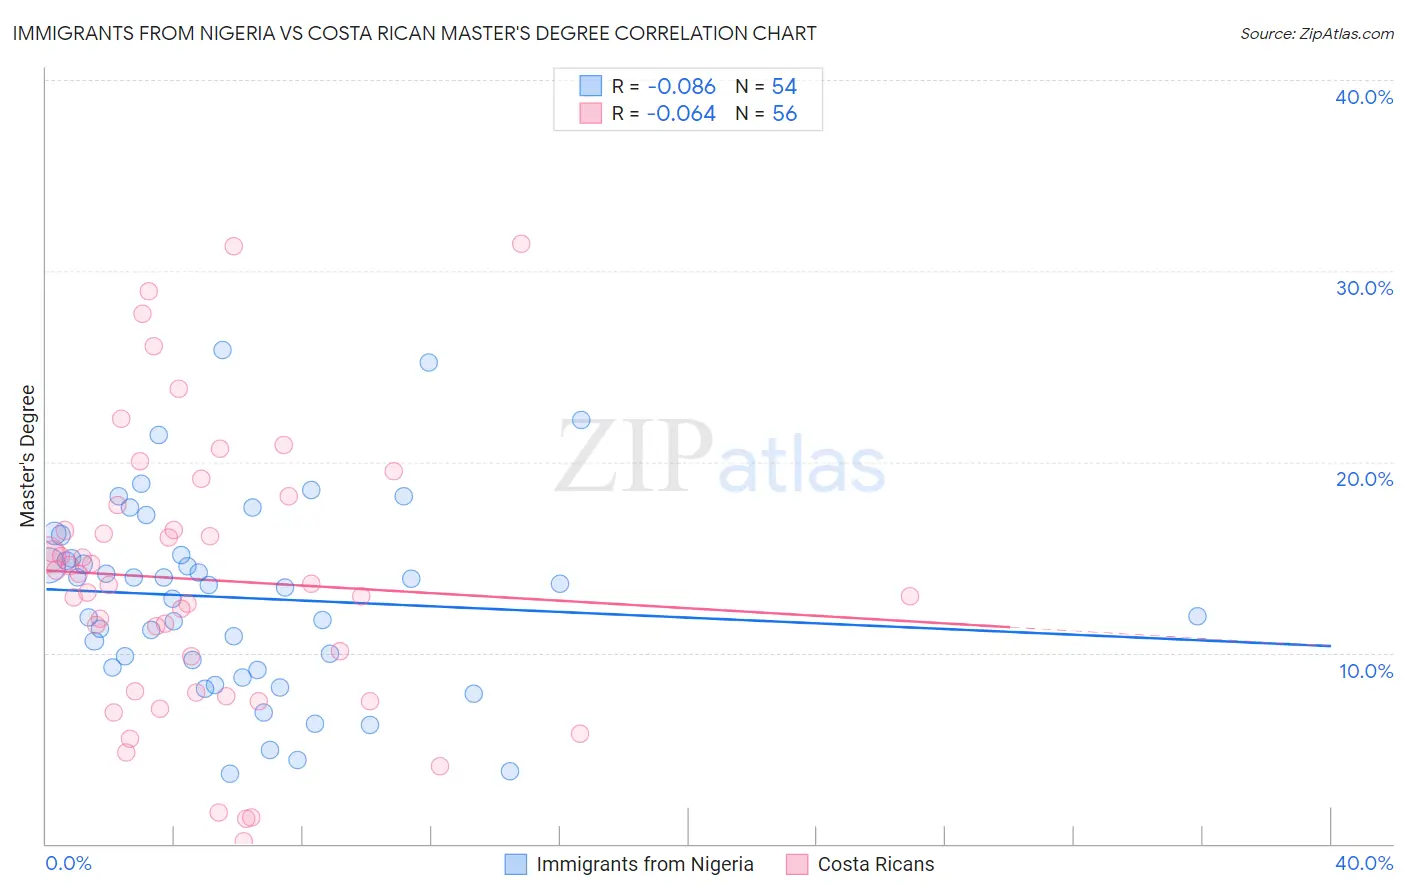
Immigrants from Nigeria vs Costa Rican Master's Degree Correlation Chart
The statistical analysis conducted on geographies consisting of 283,420,581 people shows a slight negative correlation between the proportion of Immigrants from Nigeria and percentage of population with at least master's degree education in the United States with a correlation coefficient (R) of -0.086 and weighted average of 14.6%. Similarly, the statistical analysis conducted on geographies consisting of 253,588,178 people shows a slight negative correlation between the proportion of Costa Ricans and percentage of population with at least master's degree education in the United States with a correlation coefficient (R) of -0.064 and weighted average of 15.0%, a difference of 2.7%.
Master's Degree Correlation Summary
| Measurement | Immigrants from Nigeria | Costa Rican |
| Minimum | 3.7% | 0.13% |
| Maximum | 25.9% | 31.4% |
| Range | 22.2% | 31.3% |
| Mean | 12.9% | 13.8% |
| Median | 13.5% | 13.6% |
| Interquartile 25% (IQ1) | 9.2% | 8.0% |
| Interquartile 75% (IQ3) | 15.1% | 17.1% |
| Interquartile Range (IQR) | 5.9% | 9.1% |
| Standard Deviation (Sample) | 5.0% | 7.3% |
| Standard Deviation (Population) | 5.0% | 7.2% |
Demographics Similar to Immigrants from Nigeria and Costa Ricans by Master's Degree
In terms of master's degree, the demographic groups most similar to Immigrants from Nigeria are Immigrants from Middle Africa (14.6%, a difference of 0.13%), Welsh (14.6%, a difference of 0.22%), Spaniard (14.6%, a difference of 0.45%), Immigrants (14.6%, a difference of 0.47%), and Immigrants from Costa Rica (14.7%, a difference of 0.51%). Similarly, the demographic groups most similar to Costa Ricans are Slovak (14.9%, a difference of 0.32%), Immigrants from Peru (14.9%, a difference of 0.36%), Nigerian (14.9%, a difference of 0.50%), Immigrants from Colombia (14.9%, a difference of 0.53%), and English (14.8%, a difference of 0.97%).
| Demographics | Rating | Rank | Master's Degree |
| Costa Ricans | 52.5 /100 | #173 | Average 15.0% |
| Slovaks | 50.0 /100 | #174 | Average 14.9% |
| Immigrants | Peru | 49.6 /100 | #175 | Average 14.9% |
| Nigerians | 48.6 /100 | #176 | Average 14.9% |
| Immigrants | Colombia | 48.3 /100 | #177 | Average 14.9% |
| English | 45.0 /100 | #178 | Average 14.8% |
| Immigrants | Iraq | 41.3 /100 | #179 | Average 14.8% |
| Celtics | 41.3 /100 | #180 | Average 14.8% |
| Swiss | 41.1 /100 | #181 | Average 14.7% |
| Czechs | 40.4 /100 | #182 | Average 14.7% |
| Sri Lankans | 39.6 /100 | #183 | Fair 14.7% |
| Immigrants | Zaire | 39.5 /100 | #184 | Fair 14.7% |
| Barbadians | 38.3 /100 | #185 | Fair 14.7% |
| Immigrants | Oceania | 37.1 /100 | #186 | Fair 14.7% |
| Basques | 36.5 /100 | #187 | Fair 14.7% |
| Immigrants | Costa Rica | 36.2 /100 | #188 | Fair 14.7% |
| Immigrants | Immigrants | 36.0 /100 | #189 | Fair 14.6% |
| Spaniards | 35.8 /100 | #190 | Fair 14.6% |
| Welsh | 34.2 /100 | #191 | Fair 14.6% |
| Immigrants | Middle Africa | 33.6 /100 | #192 | Fair 14.6% |
| Immigrants | Nigeria | 32.7 /100 | #193 | Fair 14.6% |