Immigrants from Nigeria vs Immigrants from Bosnia and Herzegovina Master's Degree
COMPARE
Immigrants from Nigeria
Immigrants from Bosnia and Herzegovina
Master's Degree
Master's Degree Comparison
Immigrants from Nigeria
Immigrants from Bosnia and Herzegovina
14.6%
MASTER'S DEGREE
32.7/ 100
METRIC RATING
193rd/ 347
METRIC RANK
14.3%
MASTER'S DEGREE
22.0/ 100
METRIC RATING
207th/ 347
METRIC RANK
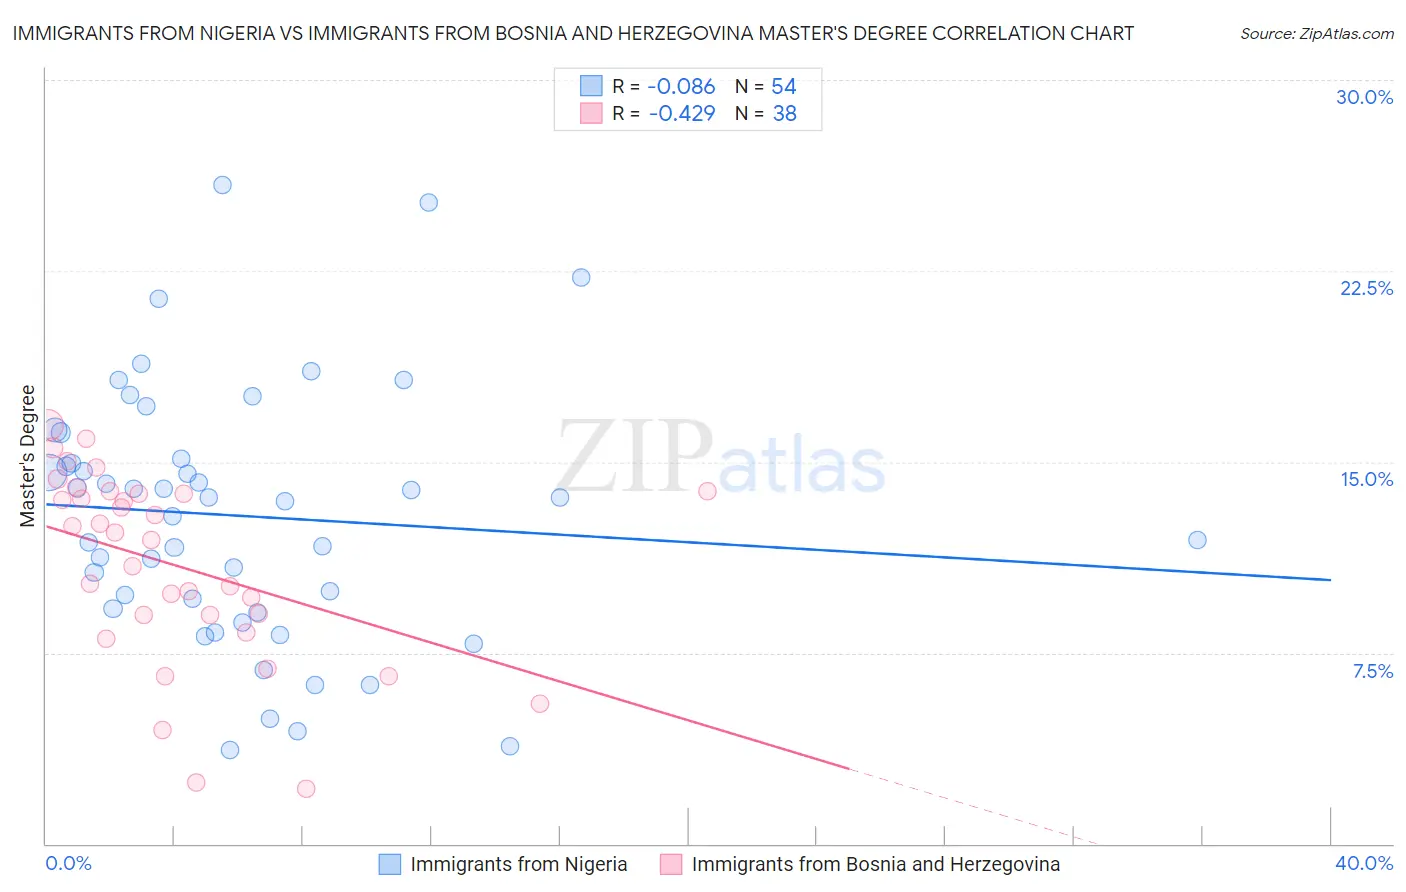
Immigrants from Nigeria vs Immigrants from Bosnia and Herzegovina Master's Degree Correlation Chart
The statistical analysis conducted on geographies consisting of 283,420,581 people shows a slight negative correlation between the proportion of Immigrants from Nigeria and percentage of population with at least master's degree education in the United States with a correlation coefficient (R) of -0.086 and weighted average of 14.6%. Similarly, the statistical analysis conducted on geographies consisting of 156,790,700 people shows a moderate negative correlation between the proportion of Immigrants from Bosnia and Herzegovina and percentage of population with at least master's degree education in the United States with a correlation coefficient (R) of -0.429 and weighted average of 14.3%, a difference of 1.8%.
Master's Degree Correlation Summary
| Measurement | Immigrants from Nigeria | Immigrants from Bosnia and Herzegovina |
| Minimum | 3.7% | 2.2% |
| Maximum | 25.9% | 16.4% |
| Range | 22.2% | 14.3% |
| Mean | 12.9% | 10.9% |
| Median | 13.5% | 12.1% |
| Interquartile 25% (IQ1) | 9.2% | 9.0% |
| Interquartile 75% (IQ3) | 15.1% | 13.8% |
| Interquartile Range (IQR) | 5.9% | 4.8% |
| Standard Deviation (Sample) | 5.0% | 3.7% |
| Standard Deviation (Population) | 5.0% | 3.6% |
Demographics Similar to Immigrants from Nigeria and Immigrants from Bosnia and Herzegovina by Master's Degree
In terms of master's degree, the demographic groups most similar to Immigrants from Nigeria are Chinese (14.6%, a difference of 0.040%), Immigrants from Middle Africa (14.6%, a difference of 0.13%), Welsh (14.6%, a difference of 0.22%), Danish (14.5%, a difference of 0.22%), and Czechoslovakian (14.5%, a difference of 0.43%). Similarly, the demographic groups most similar to Immigrants from Bosnia and Herzegovina are Scandinavian (14.4%, a difference of 0.25%), Trinidadian and Tobagonian (14.4%, a difference of 0.29%), Immigrants from Barbados (14.3%, a difference of 0.30%), French (14.4%, a difference of 0.32%), and Immigrants from Panama (14.3%, a difference of 0.39%).
| Demographics | Rating | Rank | Master's Degree |
| Spaniards | 35.8 /100 | #190 | Fair 14.6% |
| Welsh | 34.2 /100 | #191 | Fair 14.6% |
| Immigrants | Middle Africa | 33.6 /100 | #192 | Fair 14.6% |
| Immigrants | Nigeria | 32.7 /100 | #193 | Fair 14.6% |
| Chinese | 32.5 /100 | #194 | Fair 14.6% |
| Danes | 31.3 /100 | #195 | Fair 14.5% |
| Czechoslovakians | 29.9 /100 | #196 | Fair 14.5% |
| Belgians | 28.0 /100 | #197 | Fair 14.5% |
| West Indians | 27.4 /100 | #198 | Fair 14.5% |
| Immigrants | Armenia | 27.2 /100 | #199 | Fair 14.5% |
| Panamanians | 25.1 /100 | #200 | Fair 14.4% |
| Scotch-Irish | 25.0 /100 | #201 | Fair 14.4% |
| Immigrants | Western Africa | 24.9 /100 | #202 | Fair 14.4% |
| Yugoslavians | 24.3 /100 | #203 | Fair 14.4% |
| French | 23.7 /100 | #204 | Fair 14.4% |
| Trinidadians and Tobagonians | 23.5 /100 | #205 | Fair 14.4% |
| Scandinavians | 23.3 /100 | #206 | Fair 14.4% |
| Immigrants | Bosnia and Herzegovina | 22.0 /100 | #207 | Fair 14.3% |
| Immigrants | Barbados | 20.5 /100 | #208 | Fair 14.3% |
| Immigrants | Panama | 20.0 /100 | #209 | Fair 14.3% |
| Sub-Saharan Africans | 19.4 /100 | #210 | Poor 14.2% |