Immigrants from Hong Kong vs Slovak No Schooling Completed
COMPARE
Immigrants from Hong Kong
Slovak
No Schooling Completed
No Schooling Completed Comparison
Immigrants from Hong Kong
Slovaks
2.7%
NO SCHOOLING COMPLETED
0.0/ 100
METRIC RATING
290th/ 347
METRIC RANK
1.3%
NO SCHOOLING COMPLETED
100.0/ 100
METRIC RATING
2nd/ 347
METRIC RANK
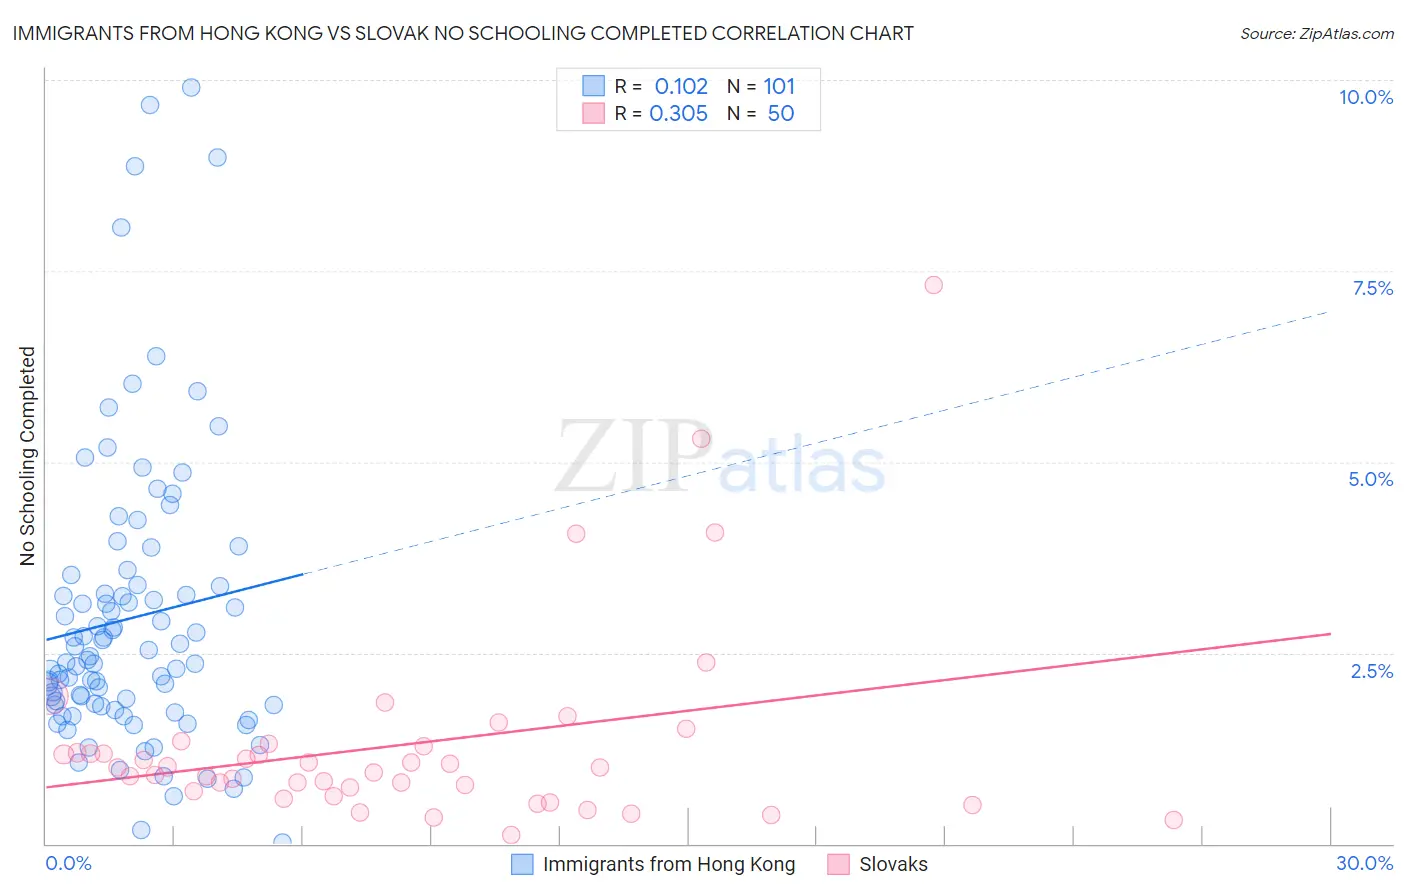
Immigrants from Hong Kong vs Slovak No Schooling Completed Correlation Chart
The statistical analysis conducted on geographies consisting of 252,436,459 people shows a poor positive correlation between the proportion of Immigrants from Hong Kong and percentage of population with no schooling in the United States with a correlation coefficient (R) of 0.102 and weighted average of 2.7%. Similarly, the statistical analysis conducted on geographies consisting of 391,654,464 people shows a mild positive correlation between the proportion of Slovaks and percentage of population with no schooling in the United States with a correlation coefficient (R) of 0.305 and weighted average of 1.3%, a difference of 101.4%.
No Schooling Completed Correlation Summary
| Measurement | Immigrants from Hong Kong | Slovak |
| Minimum | 0.020% | 0.11% |
| Maximum | 9.9% | 7.3% |
| Range | 9.9% | 7.2% |
| Mean | 3.0% | 1.3% |
| Median | 2.4% | 1.00% |
| Interquartile 25% (IQ1) | 1.8% | 0.70% |
| Interquartile 75% (IQ3) | 3.4% | 1.3% |
| Interquartile Range (IQR) | 1.6% | 0.59% |
| Standard Deviation (Sample) | 1.9% | 1.3% |
| Standard Deviation (Population) | 1.9% | 1.3% |
Similar Demographics by No Schooling Completed
Demographics Similar to Immigrants from Hong Kong by No Schooling Completed
In terms of no schooling completed, the demographic groups most similar to Immigrants from Hong Kong are Immigrants from Thailand (2.7%, a difference of 0.060%), Immigrants from St. Vincent and the Grenadines (2.7%, a difference of 0.38%), Immigrants from Afghanistan (2.7%, a difference of 0.48%), British West Indian (2.7%, a difference of 0.89%), and Immigrants from Portugal (2.7%, a difference of 1.3%).
| Demographics | Rating | Rank | No Schooling Completed |
| Immigrants | Trinidad and Tobago | 0.0 /100 | #283 | Tragic 2.6% |
| Immigrants | West Indies | 0.0 /100 | #284 | Tragic 2.7% |
| Immigrants | Barbados | 0.0 /100 | #285 | Tragic 2.7% |
| Immigrants | Portugal | 0.0 /100 | #286 | Tragic 2.7% |
| Immigrants | Afghanistan | 0.0 /100 | #287 | Tragic 2.7% |
| Immigrants | St. Vincent and the Grenadines | 0.0 /100 | #288 | Tragic 2.7% |
| Immigrants | Thailand | 0.0 /100 | #289 | Tragic 2.7% |
| Immigrants | Hong Kong | 0.0 /100 | #290 | Tragic 2.7% |
| British West Indians | 0.0 /100 | #291 | Tragic 2.7% |
| Immigrants | Grenada | 0.0 /100 | #292 | Tragic 2.8% |
| Malaysians | 0.0 /100 | #293 | Tragic 2.8% |
| Immigrants | Eritrea | 0.0 /100 | #294 | Tragic 2.8% |
| Houma | 0.0 /100 | #295 | Tragic 2.8% |
| Immigrants | Immigrants | 0.0 /100 | #296 | Tragic 2.8% |
| Immigrants | Cuba | 0.0 /100 | #297 | Tragic 2.8% |
Demographics Similar to Slovaks by No Schooling Completed
In terms of no schooling completed, the demographic groups most similar to Slovaks are Norwegian (1.3%, a difference of 0.43%), German (1.4%, a difference of 0.99%), Slovene (1.4%, a difference of 1.4%), Carpatho Rusyn (1.4%, a difference of 2.2%), and English (1.4%, a difference of 3.2%).
| Demographics | Rating | Rank | No Schooling Completed |
| Yup'ik | 100.0 /100 | #1 | Exceptional 1.2% |
| Slovaks | 100.0 /100 | #2 | Exceptional 1.3% |
| Norwegians | 100.0 /100 | #3 | Exceptional 1.3% |
| Germans | 100.0 /100 | #4 | Exceptional 1.4% |
| Slovenes | 100.0 /100 | #5 | Exceptional 1.4% |
| Carpatho Rusyns | 100.0 /100 | #6 | Exceptional 1.4% |
| English | 100.0 /100 | #7 | Exceptional 1.4% |
| Swedes | 100.0 /100 | #8 | Exceptional 1.4% |
| Scottish | 100.0 /100 | #9 | Exceptional 1.4% |
| Dutch | 100.0 /100 | #10 | Exceptional 1.4% |
| Lithuanians | 100.0 /100 | #11 | Exceptional 1.4% |
| Irish | 100.0 /100 | #12 | Exceptional 1.4% |
| Poles | 100.0 /100 | #13 | Exceptional 1.4% |
| Scotch-Irish | 100.0 /100 | #14 | Exceptional 1.5% |
| Tlingit-Haida | 100.0 /100 | #15 | Exceptional 1.5% |