Immigrants from Nigeria vs Italian No Schooling Completed
COMPARE
Immigrants from Nigeria
Italian
No Schooling Completed
No Schooling Completed Comparison
Immigrants from Nigeria
Italians
2.5%
NO SCHOOLING COMPLETED
0.2/ 100
METRIC RATING
269th/ 347
METRIC RANK
1.5%
NO SCHOOLING COMPLETED
100.0/ 100
METRIC RATING
33rd/ 347
METRIC RANK
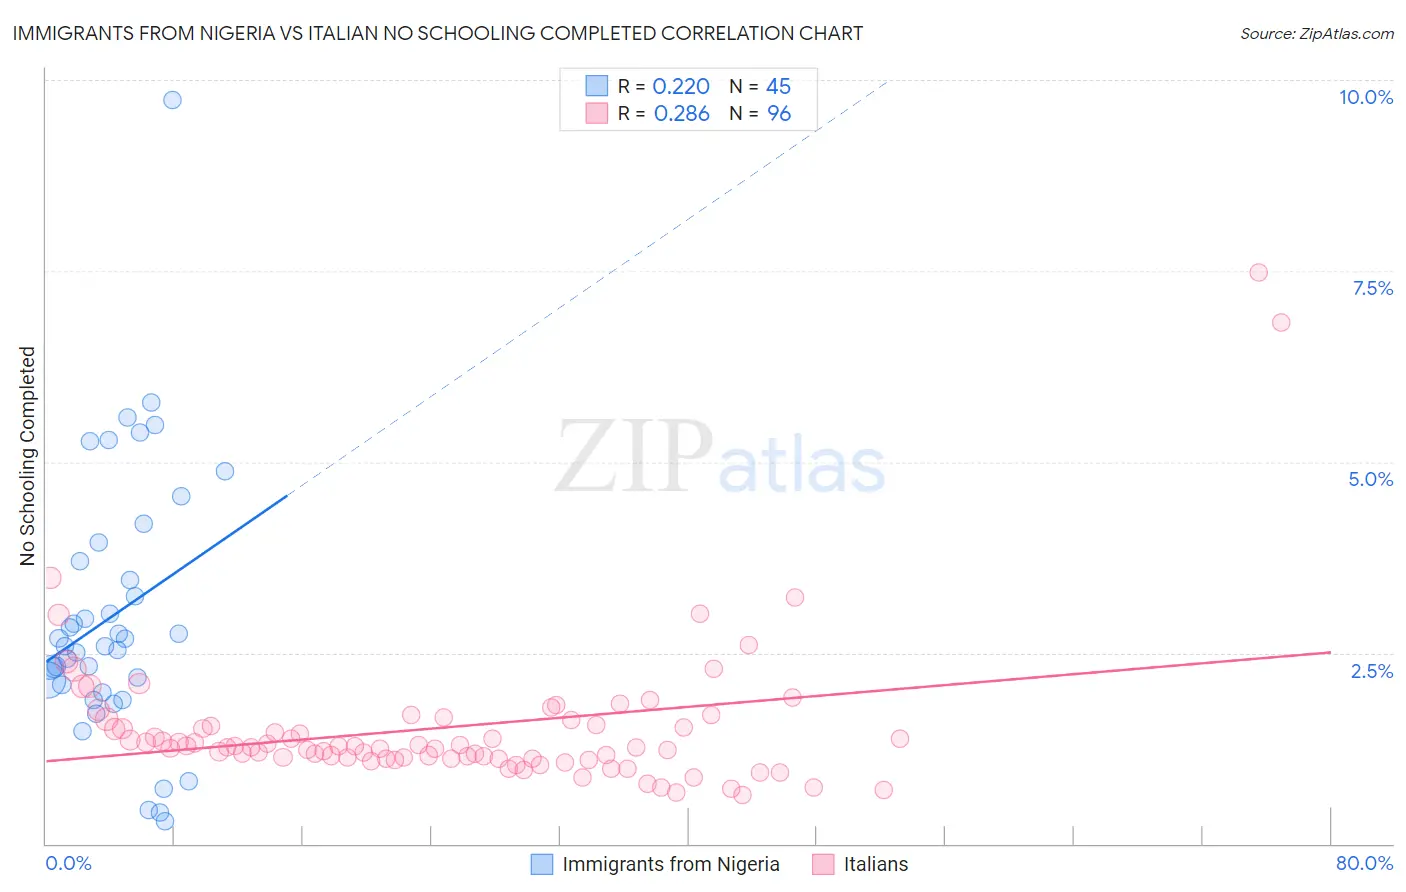
Immigrants from Nigeria vs Italian No Schooling Completed Correlation Chart
The statistical analysis conducted on geographies consisting of 282,263,250 people shows a weak positive correlation between the proportion of Immigrants from Nigeria and percentage of population with no schooling in the United States with a correlation coefficient (R) of 0.220 and weighted average of 2.5%. Similarly, the statistical analysis conducted on geographies consisting of 555,839,647 people shows a weak positive correlation between the proportion of Italians and percentage of population with no schooling in the United States with a correlation coefficient (R) of 0.286 and weighted average of 1.5%, a difference of 63.4%.
No Schooling Completed Correlation Summary
| Measurement | Immigrants from Nigeria | Italian |
| Minimum | 0.30% | 0.64% |
| Maximum | 9.7% | 7.5% |
| Range | 9.4% | 6.8% |
| Mean | 3.0% | 1.5% |
| Median | 2.6% | 1.3% |
| Interquartile 25% (IQ1) | 2.0% | 1.1% |
| Interquartile 75% (IQ3) | 3.8% | 1.6% |
| Interquartile Range (IQR) | 1.8% | 0.47% |
| Standard Deviation (Sample) | 1.8% | 0.98% |
| Standard Deviation (Population) | 1.7% | 0.98% |
Similar Demographics by No Schooling Completed
Demographics Similar to Immigrants from Nigeria by No Schooling Completed
In terms of no schooling completed, the demographic groups most similar to Immigrants from Nigeria are Immigrants from Peru (2.5%, a difference of 0.080%), Cuban (2.5%, a difference of 0.090%), Immigrants from Bolivia (2.5%, a difference of 0.62%), Taiwanese (2.5%, a difference of 0.86%), and Yuman (2.5%, a difference of 1.1%).
| Demographics | Rating | Rank | No Schooling Completed |
| Immigrants | Sierra Leone | 0.5 /100 | #262 | Tragic 2.5% |
| Immigrants | Liberia | 0.4 /100 | #263 | Tragic 2.5% |
| Indians (Asian) | 0.4 /100 | #264 | Tragic 2.5% |
| West Indians | 0.4 /100 | #265 | Tragic 2.5% |
| Fijians | 0.4 /100 | #266 | Tragic 2.5% |
| Yuman | 0.4 /100 | #267 | Tragic 2.5% |
| Taiwanese | 0.3 /100 | #268 | Tragic 2.5% |
| Immigrants | Nigeria | 0.2 /100 | #269 | Tragic 2.5% |
| Immigrants | Peru | 0.2 /100 | #270 | Tragic 2.5% |
| Cubans | 0.2 /100 | #271 | Tragic 2.5% |
| Immigrants | Bolivia | 0.2 /100 | #272 | Tragic 2.5% |
| Immigrants | Cameroon | 0.1 /100 | #273 | Tragic 2.5% |
| Ghanaians | 0.1 /100 | #274 | Tragic 2.6% |
| Immigrants | China | 0.1 /100 | #275 | Tragic 2.6% |
| Immigrants | Western Africa | 0.1 /100 | #276 | Tragic 2.6% |
Demographics Similar to Italians by No Schooling Completed
In terms of no schooling completed, the demographic groups most similar to Italians are Latvian (1.5%, a difference of 0.25%), Swiss (1.5%, a difference of 0.68%), Inupiat (1.5%, a difference of 1.1%), British (1.5%, a difference of 1.1%), and Eastern European (1.6%, a difference of 1.2%).
| Demographics | Rating | Rank | No Schooling Completed |
| Czechs | 100.0 /100 | #26 | Exceptional 1.5% |
| Scandinavians | 100.0 /100 | #27 | Exceptional 1.5% |
| French Canadians | 100.0 /100 | #28 | Exceptional 1.5% |
| Lumbee | 100.0 /100 | #29 | Exceptional 1.5% |
| British | 100.0 /100 | #30 | Exceptional 1.5% |
| Inupiat | 100.0 /100 | #31 | Exceptional 1.5% |
| Swiss | 100.0 /100 | #32 | Exceptional 1.5% |
| Italians | 100.0 /100 | #33 | Exceptional 1.5% |
| Latvians | 100.0 /100 | #34 | Exceptional 1.5% |
| Eastern Europeans | 100.0 /100 | #35 | Exceptional 1.6% |
| Aleuts | 99.9 /100 | #36 | Exceptional 1.6% |
| Belgians | 99.9 /100 | #37 | Exceptional 1.6% |
| Northern Europeans | 99.9 /100 | #38 | Exceptional 1.6% |
| Native Hawaiians | 99.9 /100 | #39 | Exceptional 1.6% |
| Luxembourgers | 99.9 /100 | #40 | Exceptional 1.6% |