Immigrants from Nigeria vs Immigrants from Denmark 6th Grade
COMPARE
Immigrants from Nigeria
Immigrants from Denmark
6th Grade
6th Grade Comparison
Immigrants from Nigeria
Immigrants from Denmark
96.4%
6TH GRADE
0.3/ 100
METRIC RATING
262nd/ 347
METRIC RANK
97.5%
6TH GRADE
98.5/ 100
METRIC RATING
98th/ 347
METRIC RANK
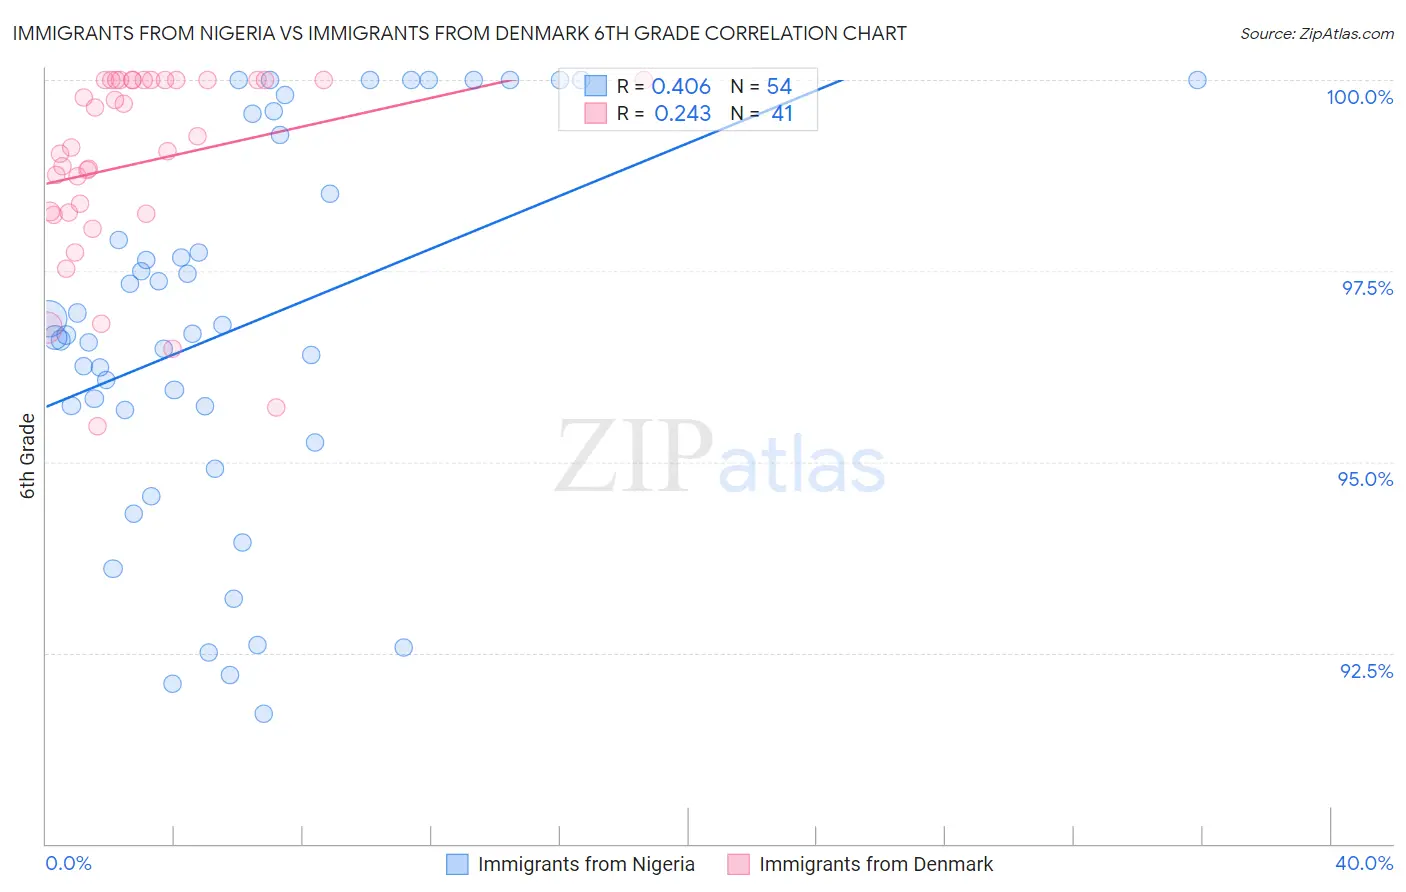
Immigrants from Nigeria vs Immigrants from Denmark 6th Grade Correlation Chart
The statistical analysis conducted on geographies consisting of 283,430,369 people shows a moderate positive correlation between the proportion of Immigrants from Nigeria and percentage of population with at least 6th grade education in the United States with a correlation coefficient (R) of 0.406 and weighted average of 96.4%. Similarly, the statistical analysis conducted on geographies consisting of 136,430,932 people shows a weak positive correlation between the proportion of Immigrants from Denmark and percentage of population with at least 6th grade education in the United States with a correlation coefficient (R) of 0.243 and weighted average of 97.5%, a difference of 1.2%.
6th Grade Correlation Summary
| Measurement | Immigrants from Nigeria | Immigrants from Denmark |
| Minimum | 91.7% | 95.5% |
| Maximum | 100.0% | 100.0% |
| Range | 8.3% | 4.5% |
| Mean | 96.8% | 98.9% |
| Median | 96.7% | 99.1% |
| Interquartile 25% (IQ1) | 95.7% | 98.3% |
| Interquartile 75% (IQ3) | 99.3% | 100.0% |
| Interquartile Range (IQR) | 3.6% | 1.7% |
| Standard Deviation (Sample) | 2.5% | 1.3% |
| Standard Deviation (Population) | 2.4% | 1.2% |
Similar Demographics by 6th Grade
Demographics Similar to Immigrants from Nigeria by 6th Grade
In terms of 6th grade, the demographic groups most similar to Immigrants from Nigeria are Immigrants from Colombia (96.4%, a difference of 0.010%), Armenian (96.4%, a difference of 0.020%), Immigrants from Jamaica (96.4%, a difference of 0.020%), Ghanaian (96.4%, a difference of 0.030%), and Afghan (96.4%, a difference of 0.030%).
| Demographics | Rating | Rank | 6th Grade |
| Immigrants | Congo | 0.6 /100 | #255 | Tragic 96.5% |
| U.S. Virgin Islanders | 0.5 /100 | #256 | Tragic 96.5% |
| Taiwanese | 0.5 /100 | #257 | Tragic 96.5% |
| Immigrants | China | 0.4 /100 | #258 | Tragic 96.4% |
| South Americans | 0.4 /100 | #259 | Tragic 96.4% |
| Peruvians | 0.4 /100 | #260 | Tragic 96.4% |
| Immigrants | Sierra Leone | 0.4 /100 | #261 | Tragic 96.4% |
| Immigrants | Nigeria | 0.3 /100 | #262 | Tragic 96.4% |
| Immigrants | Colombia | 0.3 /100 | #263 | Tragic 96.4% |
| Armenians | 0.3 /100 | #264 | Tragic 96.4% |
| Immigrants | Jamaica | 0.2 /100 | #265 | Tragic 96.4% |
| Ghanaians | 0.2 /100 | #266 | Tragic 96.4% |
| Afghans | 0.2 /100 | #267 | Tragic 96.4% |
| Immigrants | Uzbekistan | 0.2 /100 | #268 | Tragic 96.3% |
| West Indians | 0.2 /100 | #269 | Tragic 96.3% |
Demographics Similar to Immigrants from Denmark by 6th Grade
In terms of 6th grade, the demographic groups most similar to Immigrants from Denmark are Yugoslavian (97.5%, a difference of 0.0%), Romanian (97.5%, a difference of 0.010%), Cree (97.5%, a difference of 0.010%), Cypriot (97.5%, a difference of 0.010%), and Immigrants from Ireland (97.5%, a difference of 0.010%).
| Demographics | Rating | Rank | 6th Grade |
| Immigrants | Western Europe | 98.8 /100 | #91 | Exceptional 97.5% |
| Romanians | 98.7 /100 | #92 | Exceptional 97.5% |
| Cree | 98.7 /100 | #93 | Exceptional 97.5% |
| Cypriots | 98.7 /100 | #94 | Exceptional 97.5% |
| Immigrants | Ireland | 98.7 /100 | #95 | Exceptional 97.5% |
| Immigrants | Germany | 98.6 /100 | #96 | Exceptional 97.5% |
| Immigrants | Sweden | 98.6 /100 | #97 | Exceptional 97.5% |
| Immigrants | Denmark | 98.5 /100 | #98 | Exceptional 97.5% |
| Yugoslavians | 98.5 /100 | #99 | Exceptional 97.5% |
| Turks | 98.3 /100 | #100 | Exceptional 97.5% |
| South Africans | 98.2 /100 | #101 | Exceptional 97.5% |
| Choctaw | 98.0 /100 | #102 | Exceptional 97.5% |
| Bhutanese | 98.0 /100 | #103 | Exceptional 97.5% |
| German Russians | 97.9 /100 | #104 | Exceptional 97.5% |
| Cheyenne | 97.9 /100 | #105 | Exceptional 97.5% |