Immigrants from Nigeria vs Jordanian 11th Grade
COMPARE
Immigrants from Nigeria
Jordanian
11th Grade
11th Grade Comparison
Immigrants from Nigeria
Jordanians
91.4%
11TH GRADE
0.8/ 100
METRIC RATING
252nd/ 347
METRIC RANK
93.4%
11TH GRADE
97.8/ 100
METRIC RATING
114th/ 347
METRIC RANK
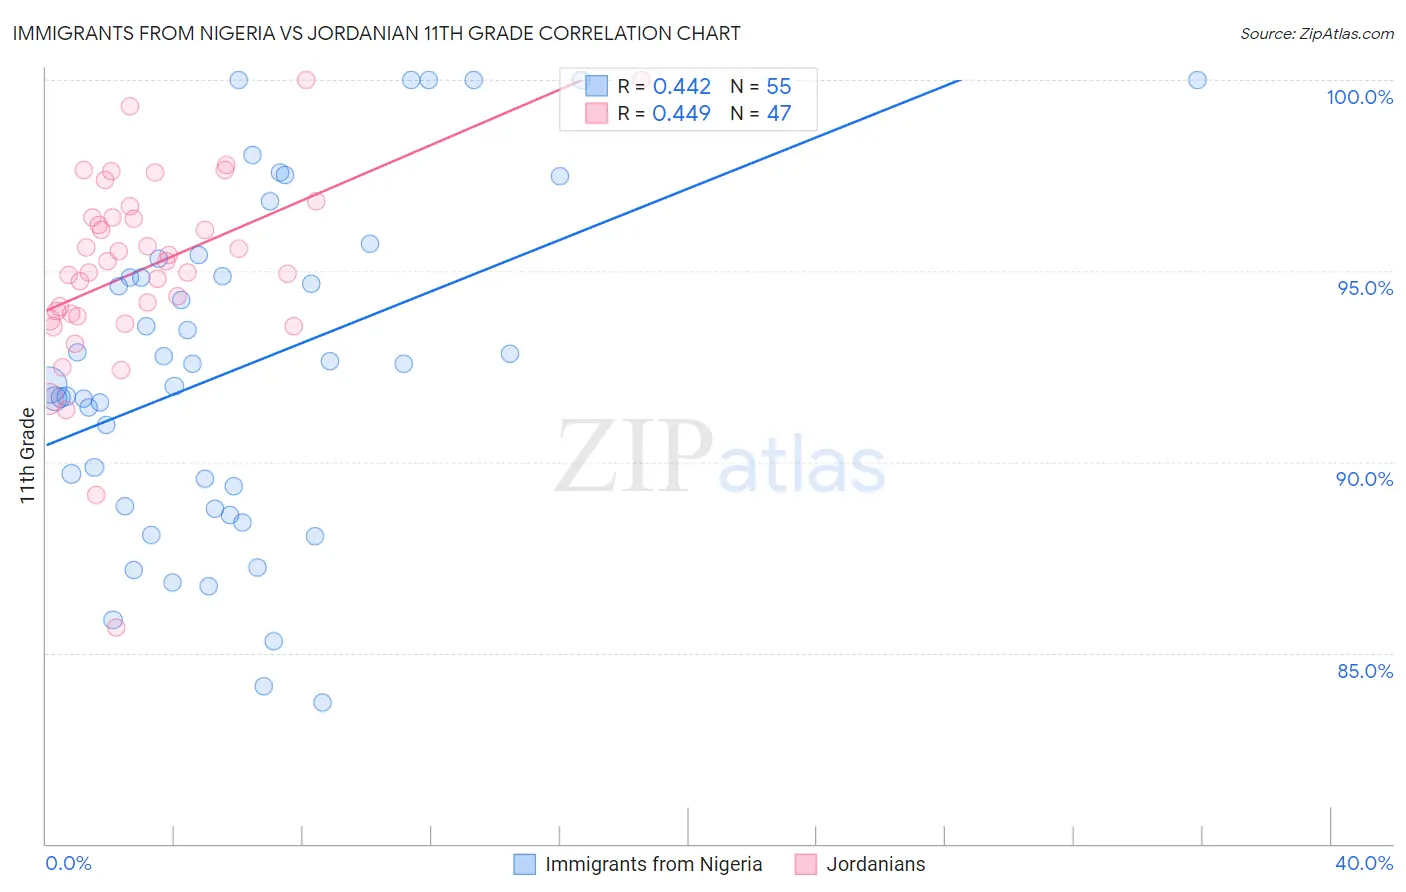
Immigrants from Nigeria vs Jordanian 11th Grade Correlation Chart
The statistical analysis conducted on geographies consisting of 283,441,873 people shows a moderate positive correlation between the proportion of Immigrants from Nigeria and percentage of population with at least 11th grade education in the United States with a correlation coefficient (R) of 0.442 and weighted average of 91.4%. Similarly, the statistical analysis conducted on geographies consisting of 166,402,085 people shows a moderate positive correlation between the proportion of Jordanians and percentage of population with at least 11th grade education in the United States with a correlation coefficient (R) of 0.449 and weighted average of 93.4%, a difference of 2.1%.
11th Grade Correlation Summary
| Measurement | Immigrants from Nigeria | Jordanian |
| Minimum | 83.7% | 85.7% |
| Maximum | 100.0% | 100.0% |
| Range | 16.3% | 14.3% |
| Mean | 92.5% | 95.1% |
| Median | 92.6% | 95.2% |
| Interquartile 25% (IQ1) | 88.8% | 93.8% |
| Interquartile 75% (IQ3) | 95.3% | 96.4% |
| Interquartile Range (IQR) | 6.5% | 2.6% |
| Standard Deviation (Sample) | 4.4% | 2.6% |
| Standard Deviation (Population) | 4.3% | 2.5% |
Similar Demographics by 11th Grade
Demographics Similar to Immigrants from Nigeria by 11th Grade
In terms of 11th grade, the demographic groups most similar to Immigrants from Nigeria are Immigrants from Costa Rica (91.4%, a difference of 0.010%), Immigrants from South America (91.4%, a difference of 0.010%), Immigrants from Eritrea (91.4%, a difference of 0.020%), Ghanaian (91.5%, a difference of 0.030%), and Black/African American (91.4%, a difference of 0.030%).
| Demographics | Rating | Rank | 11th Grade |
| Africans | 1.3 /100 | #245 | Tragic 91.5% |
| Seminole | 1.2 /100 | #246 | Tragic 91.5% |
| Immigrants | Philippines | 1.0 /100 | #247 | Tragic 91.5% |
| Immigrants | Uzbekistan | 1.0 /100 | #248 | Tragic 91.5% |
| Peruvians | 1.0 /100 | #249 | Tragic 91.5% |
| Ghanaians | 0.9 /100 | #250 | Tragic 91.5% |
| Immigrants | Costa Rica | 0.9 /100 | #251 | Tragic 91.4% |
| Immigrants | Nigeria | 0.8 /100 | #252 | Tragic 91.4% |
| Immigrants | South America | 0.8 /100 | #253 | Tragic 91.4% |
| Immigrants | Eritrea | 0.7 /100 | #254 | Tragic 91.4% |
| Blacks/African Americans | 0.7 /100 | #255 | Tragic 91.4% |
| Immigrants | Senegal | 0.7 /100 | #256 | Tragic 91.4% |
| Cajuns | 0.7 /100 | #257 | Tragic 91.4% |
| Immigrants | Colombia | 0.6 /100 | #258 | Tragic 91.4% |
| Jamaicans | 0.6 /100 | #259 | Tragic 91.4% |
Demographics Similar to Jordanians by 11th Grade
In terms of 11th grade, the demographic groups most similar to Jordanians are Immigrants from Zimbabwe (93.4%, a difference of 0.0%), Palestinian (93.4%, a difference of 0.010%), Immigrants from Germany (93.4%, a difference of 0.030%), Immigrants from Hungary (93.4%, a difference of 0.030%), and Yugoslavian (93.4%, a difference of 0.040%).
| Demographics | Rating | Rank | 11th Grade |
| Immigrants | Norway | 98.4 /100 | #107 | Exceptional 93.5% |
| Alaska Natives | 98.4 /100 | #108 | Exceptional 93.5% |
| Immigrants | Kuwait | 98.4 /100 | #109 | Exceptional 93.5% |
| Syrians | 98.4 /100 | #110 | Exceptional 93.4% |
| Yugoslavians | 98.1 /100 | #111 | Exceptional 93.4% |
| Immigrants | Germany | 98.0 /100 | #112 | Exceptional 93.4% |
| Immigrants | Zimbabwe | 97.8 /100 | #113 | Exceptional 93.4% |
| Jordanians | 97.8 /100 | #114 | Exceptional 93.4% |
| Palestinians | 97.7 /100 | #115 | Exceptional 93.4% |
| Immigrants | Hungary | 97.5 /100 | #116 | Exceptional 93.4% |
| Whites/Caucasians | 97.4 /100 | #117 | Exceptional 93.3% |
| Immigrants | Korea | 97.0 /100 | #118 | Exceptional 93.3% |
| Israelis | 97.0 /100 | #119 | Exceptional 93.3% |
| Immigrants | Russia | 96.6 /100 | #120 | Exceptional 93.3% |
| German Russians | 96.4 /100 | #121 | Exceptional 93.3% |