Cuban vs African Master's Degree
COMPARE
Cuban
African
Master's Degree
Master's Degree Comparison
Cubans
Africans
12.1%
MASTER'S DEGREE
0.3/ 100
METRIC RATING
275th/ 347
METRIC RANK
12.9%
MASTER'S DEGREE
1.4/ 100
METRIC RATING
248th/ 347
METRIC RANK
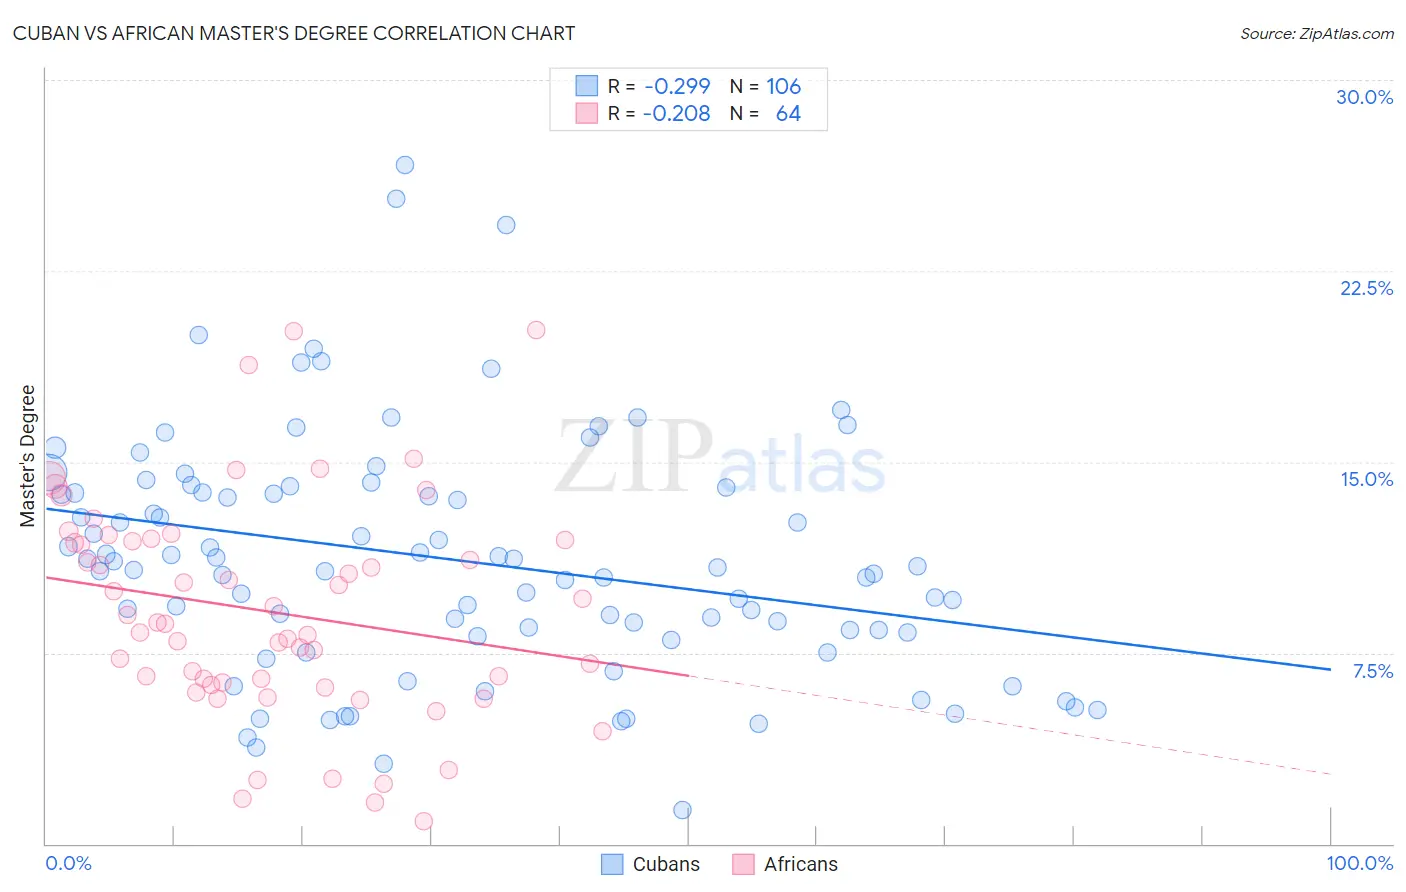
Cuban vs African Master's Degree Correlation Chart
The statistical analysis conducted on geographies consisting of 449,063,887 people shows a weak negative correlation between the proportion of Cubans and percentage of population with at least master's degree education in the United States with a correlation coefficient (R) of -0.299 and weighted average of 12.1%. Similarly, the statistical analysis conducted on geographies consisting of 469,751,464 people shows a weak negative correlation between the proportion of Africans and percentage of population with at least master's degree education in the United States with a correlation coefficient (R) of -0.208 and weighted average of 12.9%, a difference of 6.7%.
Master's Degree Correlation Summary
| Measurement | Cuban | African |
| Minimum | 1.3% | 0.89% |
| Maximum | 26.7% | 20.2% |
| Range | 25.4% | 19.3% |
| Mean | 11.1% | 9.1% |
| Median | 10.8% | 8.6% |
| Interquartile 25% (IQ1) | 8.3% | 6.3% |
| Interquartile 75% (IQ3) | 13.8% | 11.9% |
| Interquartile Range (IQR) | 5.5% | 5.6% |
| Standard Deviation (Sample) | 4.7% | 4.3% |
| Standard Deviation (Population) | 4.7% | 4.2% |
Similar Demographics by Master's Degree
Demographics Similar to Cubans by Master's Degree
In terms of master's degree, the demographic groups most similar to Cubans are Cape Verdean (12.1%, a difference of 0.020%), Black/African American (12.1%, a difference of 0.050%), Immigrants from Caribbean (12.1%, a difference of 0.060%), Potawatomi (12.1%, a difference of 0.070%), and Blackfeet (12.1%, a difference of 0.10%).
| Demographics | Rating | Rank | Master's Degree |
| Native Hawaiians | 0.4 /100 | #268 | Tragic 12.3% |
| Central Americans | 0.3 /100 | #269 | Tragic 12.2% |
| Salvadorans | 0.3 /100 | #270 | Tragic 12.2% |
| Haitians | 0.3 /100 | #271 | Tragic 12.1% |
| Comanche | 0.3 /100 | #272 | Tragic 12.1% |
| Blackfeet | 0.3 /100 | #273 | Tragic 12.1% |
| Cape Verdeans | 0.3 /100 | #274 | Tragic 12.1% |
| Cubans | 0.3 /100 | #275 | Tragic 12.1% |
| Blacks/African Americans | 0.3 /100 | #276 | Tragic 12.1% |
| Immigrants | Caribbean | 0.3 /100 | #277 | Tragic 12.1% |
| Potawatomi | 0.3 /100 | #278 | Tragic 12.1% |
| Immigrants | Belize | 0.2 /100 | #279 | Tragic 12.1% |
| Immigrants | Dominican Republic | 0.2 /100 | #280 | Tragic 12.1% |
| Malaysians | 0.2 /100 | #281 | Tragic 12.0% |
| Immigrants | El Salvador | 0.2 /100 | #282 | Tragic 12.0% |
Demographics Similar to Africans by Master's Degree
In terms of master's degree, the demographic groups most similar to Africans are Iroquois (12.9%, a difference of 0.090%), Immigrants from Cambodia (12.9%, a difference of 0.12%), Immigrants from Bahamas (12.9%, a difference of 0.16%), Cree (12.8%, a difference of 0.31%), and Liberian (12.8%, a difference of 0.32%).
| Demographics | Rating | Rank | Master's Degree |
| U.S. Virgin Islanders | 2.1 /100 | #241 | Tragic 13.1% |
| Spanish Americans | 1.9 /100 | #242 | Tragic 13.0% |
| Immigrants | Jamaica | 1.9 /100 | #243 | Tragic 13.0% |
| Delaware | 1.7 /100 | #244 | Tragic 13.0% |
| Immigrants | Bahamas | 1.4 /100 | #245 | Tragic 12.9% |
| Immigrants | Cambodia | 1.4 /100 | #246 | Tragic 12.9% |
| Iroquois | 1.4 /100 | #247 | Tragic 12.9% |
| Africans | 1.4 /100 | #248 | Tragic 12.9% |
| Cree | 1.3 /100 | #249 | Tragic 12.8% |
| Liberians | 1.3 /100 | #250 | Tragic 12.8% |
| Tlingit-Haida | 1.3 /100 | #251 | Tragic 12.8% |
| French American Indians | 1.0 /100 | #252 | Tragic 12.7% |
| Immigrants | Dominica | 0.8 /100 | #253 | Tragic 12.6% |
| Indonesians | 0.8 /100 | #254 | Tragic 12.6% |
| Immigrants | Congo | 0.8 /100 | #255 | Tragic 12.6% |