Immigrants from Nicaragua vs Pennsylvania German Female Unemployment
COMPARE
Immigrants from Nicaragua
Pennsylvania German
Female Unemployment
Female Unemployment Comparison
Immigrants from Nicaragua
Pennsylvania Germans
5.4%
FEMALE UNEMPLOYMENT
10.2/ 100
METRIC RATING
215th/ 347
METRIC RANK
4.8%
FEMALE UNEMPLOYMENT
99.6/ 100
METRIC RATING
37th/ 347
METRIC RANK
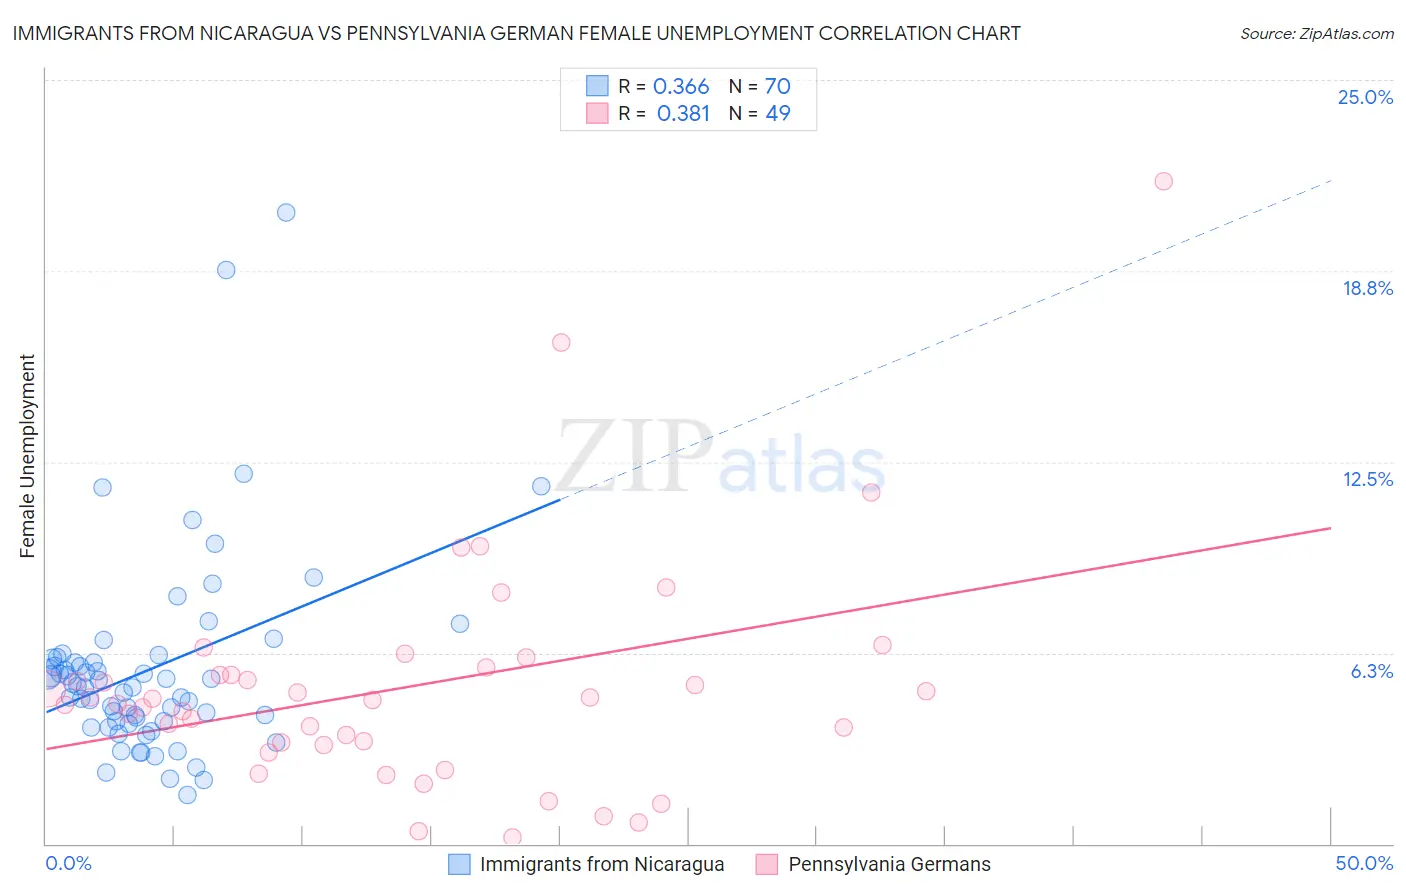
Immigrants from Nicaragua vs Pennsylvania German Female Unemployment Correlation Chart
The statistical analysis conducted on geographies consisting of 235,945,164 people shows a mild positive correlation between the proportion of Immigrants from Nicaragua and unemploymnet rate among females in the United States with a correlation coefficient (R) of 0.366 and weighted average of 5.4%. Similarly, the statistical analysis conducted on geographies consisting of 232,382,723 people shows a mild positive correlation between the proportion of Pennsylvania Germans and unemploymnet rate among females in the United States with a correlation coefficient (R) of 0.381 and weighted average of 4.8%, a difference of 12.7%.
Female Unemployment Correlation Summary
| Measurement | Immigrants from Nicaragua | Pennsylvania German |
| Minimum | 1.6% | 0.20% |
| Maximum | 20.7% | 21.7% |
| Range | 19.1% | 21.5% |
| Mean | 5.7% | 5.1% |
| Median | 5.1% | 4.7% |
| Interquartile 25% (IQ1) | 4.0% | 3.3% |
| Interquartile 75% (IQ3) | 6.0% | 5.6% |
| Interquartile Range (IQR) | 2.0% | 2.4% |
| Standard Deviation (Sample) | 3.3% | 3.8% |
| Standard Deviation (Population) | 3.2% | 3.7% |
Similar Demographics by Female Unemployment
Demographics Similar to Immigrants from Nicaragua by Female Unemployment
In terms of female unemployment, the demographic groups most similar to Immigrants from Nicaragua are Seminole (5.4%, a difference of 0.020%), Comanche (5.4%, a difference of 0.020%), Samoan (5.4%, a difference of 0.070%), Peruvian (5.4%, a difference of 0.10%), and Uruguayan (5.4%, a difference of 0.19%).
| Demographics | Rating | Rank | Female Unemployment |
| Immigrants | Costa Rica | 13.7 /100 | #208 | Poor 5.4% |
| Koreans | 13.4 /100 | #209 | Poor 5.4% |
| Choctaw | 12.3 /100 | #210 | Poor 5.4% |
| Ottawa | 11.6 /100 | #211 | Poor 5.4% |
| Uruguayans | 11.4 /100 | #212 | Poor 5.4% |
| Samoans | 10.6 /100 | #213 | Poor 5.4% |
| Seminole | 10.3 /100 | #214 | Poor 5.4% |
| Immigrants | Nicaragua | 10.2 /100 | #215 | Poor 5.4% |
| Comanche | 10.0 /100 | #216 | Poor 5.4% |
| Peruvians | 9.6 /100 | #217 | Tragic 5.4% |
| Bermudans | 9.0 /100 | #218 | Tragic 5.4% |
| South Americans | 8.6 /100 | #219 | Tragic 5.4% |
| Immigrants | Africa | 8.5 /100 | #220 | Tragic 5.4% |
| Brazilians | 7.3 /100 | #221 | Tragic 5.5% |
| Nicaraguans | 7.2 /100 | #222 | Tragic 5.5% |
Demographics Similar to Pennsylvania Germans by Female Unemployment
In terms of female unemployment, the demographic groups most similar to Pennsylvania Germans are Northern European (4.8%, a difference of 0.11%), Scotch-Irish (4.8%, a difference of 0.12%), French (4.8%, a difference of 0.16%), Yugoslavian (4.8%, a difference of 0.36%), and Tongan (4.8%, a difference of 0.41%).
| Demographics | Rating | Rank | Female Unemployment |
| Lithuanians | 99.8 /100 | #30 | Exceptional 4.7% |
| Sudanese | 99.8 /100 | #31 | Exceptional 4.8% |
| Slovaks | 99.8 /100 | #32 | Exceptional 4.8% |
| Czechoslovakians | 99.7 /100 | #33 | Exceptional 4.8% |
| Zimbabweans | 99.7 /100 | #34 | Exceptional 4.8% |
| French Canadians | 99.7 /100 | #35 | Exceptional 4.8% |
| Yugoslavians | 99.7 /100 | #36 | Exceptional 4.8% |
| Pennsylvania Germans | 99.6 /100 | #37 | Exceptional 4.8% |
| Northern Europeans | 99.6 /100 | #38 | Exceptional 4.8% |
| Scotch-Irish | 99.6 /100 | #39 | Exceptional 4.8% |
| French | 99.6 /100 | #40 | Exceptional 4.8% |
| Tongans | 99.5 /100 | #41 | Exceptional 4.8% |
| Italians | 99.5 /100 | #42 | Exceptional 4.8% |
| Eastern Europeans | 99.4 /100 | #43 | Exceptional 4.9% |
| Greeks | 99.4 /100 | #44 | Exceptional 4.9% |