Immigrants from Nepal vs Laotian Associate's Degree
COMPARE
Immigrants from Nepal
Laotian
Associate's Degree
Associate's Degree Comparison
Immigrants from Nepal
Laotians
49.5%
ASSOCIATE'S DEGREE
97.5/ 100
METRIC RATING
100th/ 347
METRIC RANK
49.9%
ASSOCIATE'S DEGREE
98.4/ 100
METRIC RATING
94th/ 347
METRIC RANK
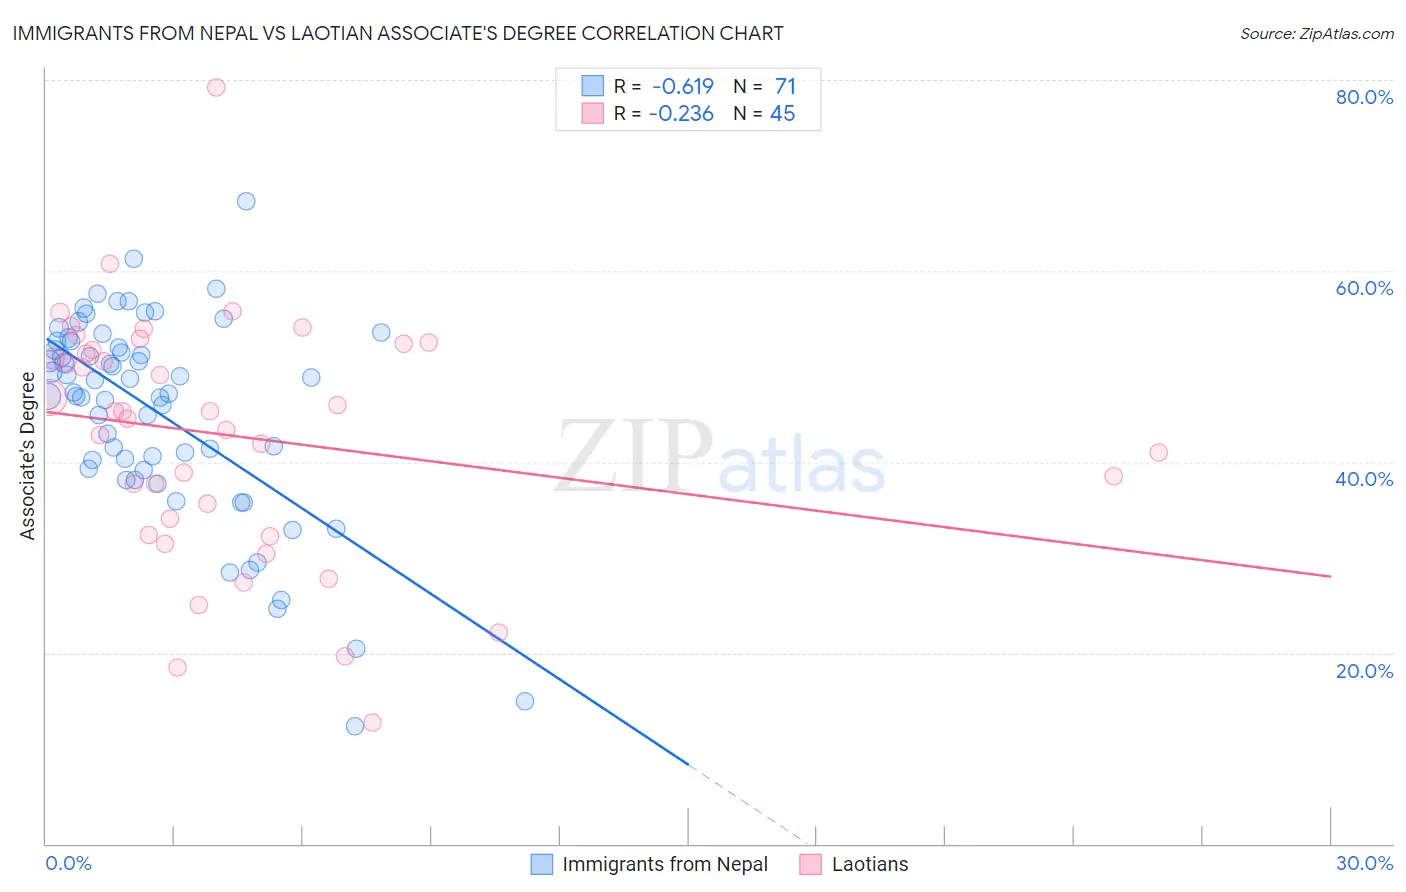
Immigrants from Nepal vs Laotian Associate's Degree Correlation Chart
The statistical analysis conducted on geographies consisting of 186,769,874 people shows a significant negative correlation between the proportion of Immigrants from Nepal and percentage of population with at least associate's degree education in the United States with a correlation coefficient (R) of -0.619 and weighted average of 49.5%. Similarly, the statistical analysis conducted on geographies consisting of 224,847,979 people shows a weak negative correlation between the proportion of Laotians and percentage of population with at least associate's degree education in the United States with a correlation coefficient (R) of -0.236 and weighted average of 49.9%, a difference of 0.78%.
Associate's Degree Correlation Summary
| Measurement | Immigrants from Nepal | Laotian |
| Minimum | 12.3% | 12.7% |
| Maximum | 67.3% | 79.2% |
| Range | 55.0% | 66.5% |
| Mean | 45.2% | 42.7% |
| Median | 47.3% | 45.3% |
| Interquartile 25% (IQ1) | 39.2% | 33.2% |
| Interquartile 75% (IQ3) | 52.6% | 52.1% |
| Interquartile Range (IQR) | 13.3% | 18.9% |
| Standard Deviation (Sample) | 10.7% | 12.8% |
| Standard Deviation (Population) | 10.6% | 12.6% |
Demographics Similar to Immigrants from Nepal and Laotians by Associate's Degree
In terms of associate's degree, the demographic groups most similar to Immigrants from Nepal are Northern European (49.5%, a difference of 0.16%), Chilean (49.4%, a difference of 0.19%), Macedonian (49.6%, a difference of 0.22%), Immigrants from Northern Africa (49.7%, a difference of 0.28%), and Ukrainian (49.4%, a difference of 0.29%). Similarly, the demographic groups most similar to Laotians are Immigrants from Brazil (50.0%, a difference of 0.13%), Immigrants from North America (50.1%, a difference of 0.28%), Immigrants from Western Asia (50.1%, a difference of 0.31%), Immigrants from Western Europe (50.1%, a difference of 0.39%), and Immigrants from Ethiopia (50.1%, a difference of 0.39%).
| Demographics | Rating | Rank | Associate's Degree |
| Immigrants | Moldova | 98.8 /100 | #87 | Exceptional 50.2% |
| Immigrants | Canada | 98.7 /100 | #88 | Exceptional 50.1% |
| Immigrants | Western Europe | 98.7 /100 | #89 | Exceptional 50.1% |
| Immigrants | Ethiopia | 98.7 /100 | #90 | Exceptional 50.1% |
| Immigrants | Western Asia | 98.7 /100 | #91 | Exceptional 50.1% |
| Immigrants | North America | 98.7 /100 | #92 | Exceptional 50.1% |
| Immigrants | Brazil | 98.5 /100 | #93 | Exceptional 50.0% |
| Laotians | 98.4 /100 | #94 | Exceptional 49.9% |
| Immigrants | England | 98.0 /100 | #95 | Exceptional 49.7% |
| Romanians | 98.0 /100 | #96 | Exceptional 49.7% |
| Immigrants | Ukraine | 98.0 /100 | #97 | Exceptional 49.7% |
| Immigrants | Northern Africa | 97.9 /100 | #98 | Exceptional 49.7% |
| Macedonians | 97.8 /100 | #99 | Exceptional 49.6% |
| Immigrants | Nepal | 97.5 /100 | #100 | Exceptional 49.5% |
| Northern Europeans | 97.3 /100 | #101 | Exceptional 49.5% |
| Chileans | 97.3 /100 | #102 | Exceptional 49.4% |
| Ukrainians | 97.1 /100 | #103 | Exceptional 49.4% |
| Venezuelans | 97.0 /100 | #104 | Exceptional 49.4% |
| Croatians | 96.8 /100 | #105 | Exceptional 49.3% |
| Immigrants | Italy | 96.7 /100 | #106 | Exceptional 49.3% |
| Syrians | 96.7 /100 | #107 | Exceptional 49.3% |