Immigrants from Nepal vs Palestinian Associate's Degree
COMPARE
Immigrants from Nepal
Palestinian
Associate's Degree
Associate's Degree Comparison
Immigrants from Nepal
Palestinians
49.5%
ASSOCIATE'S DEGREE
97.5/ 100
METRIC RATING
100th/ 347
METRIC RANK
49.0%
ASSOCIATE'S DEGREE
95.3/ 100
METRIC RATING
113th/ 347
METRIC RANK
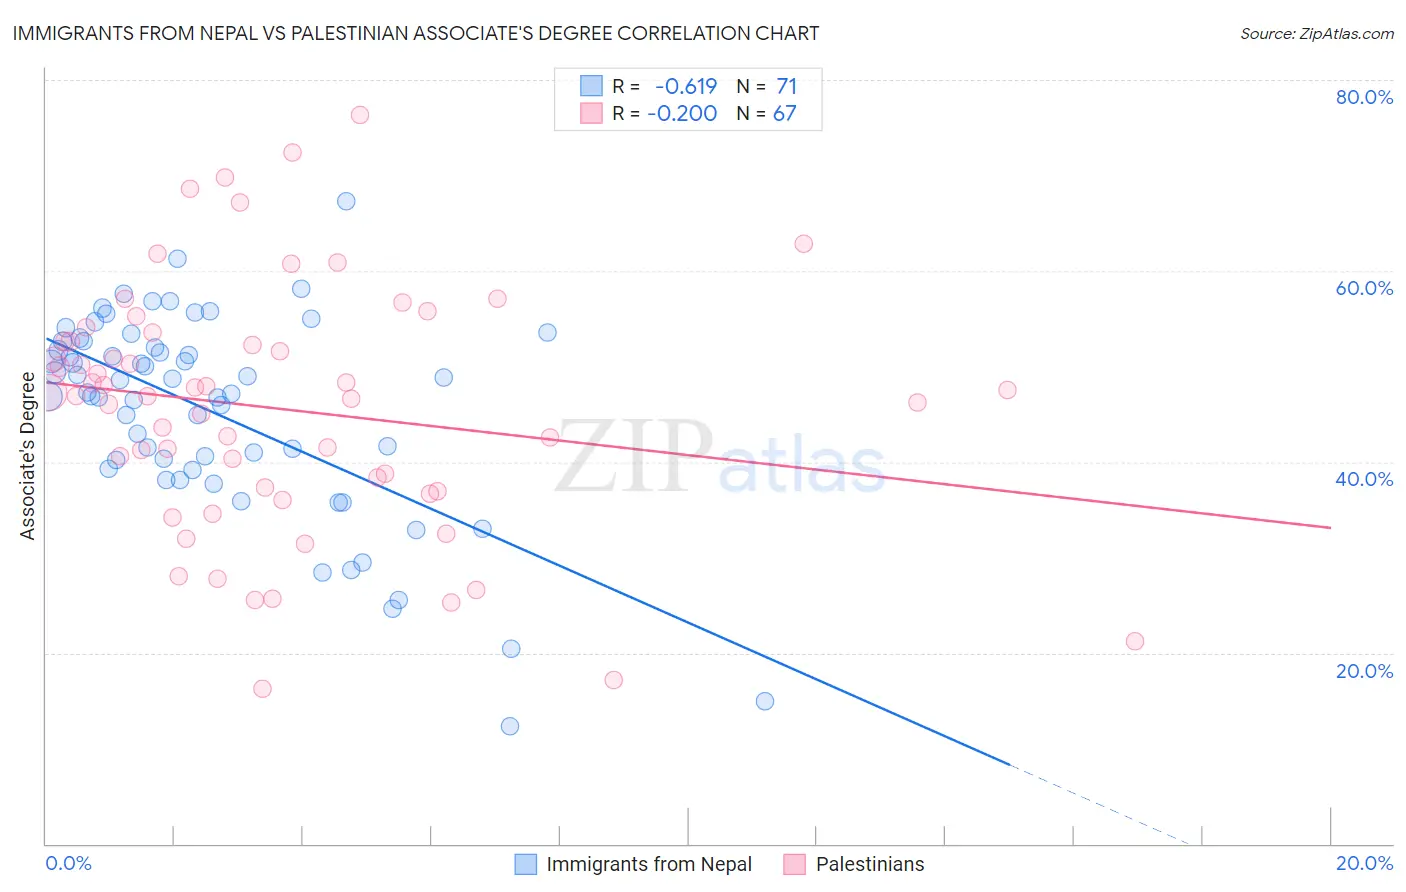
Immigrants from Nepal vs Palestinian Associate's Degree Correlation Chart
The statistical analysis conducted on geographies consisting of 186,769,874 people shows a significant negative correlation between the proportion of Immigrants from Nepal and percentage of population with at least associate's degree education in the United States with a correlation coefficient (R) of -0.619 and weighted average of 49.5%. Similarly, the statistical analysis conducted on geographies consisting of 216,454,143 people shows a weak negative correlation between the proportion of Palestinians and percentage of population with at least associate's degree education in the United States with a correlation coefficient (R) of -0.200 and weighted average of 49.0%, a difference of 1.2%.
Associate's Degree Correlation Summary
| Measurement | Immigrants from Nepal | Palestinian |
| Minimum | 12.3% | 16.3% |
| Maximum | 67.3% | 76.3% |
| Range | 55.0% | 60.0% |
| Mean | 45.2% | 45.5% |
| Median | 47.3% | 46.9% |
| Interquartile 25% (IQ1) | 39.2% | 36.9% |
| Interquartile 75% (IQ3) | 52.6% | 52.6% |
| Interquartile Range (IQR) | 13.3% | 15.7% |
| Standard Deviation (Sample) | 10.7% | 13.0% |
| Standard Deviation (Population) | 10.6% | 12.9% |
Demographics Similar to Immigrants from Nepal and Palestinians by Associate's Degree
In terms of associate's degree, the demographic groups most similar to Immigrants from Nepal are Northern European (49.5%, a difference of 0.16%), Chilean (49.4%, a difference of 0.19%), Macedonian (49.6%, a difference of 0.22%), Immigrants from Northern Africa (49.7%, a difference of 0.28%), and Ukrainian (49.4%, a difference of 0.29%). Similarly, the demographic groups most similar to Palestinians are Immigrants from Chile (49.0%, a difference of 0.0%), Arab (49.0%, a difference of 0.0%), Luxembourger (48.9%, a difference of 0.070%), British (48.9%, a difference of 0.13%), and Immigrants from Venezuela (49.1%, a difference of 0.19%).
| Demographics | Rating | Rank | Associate's Degree |
| Romanians | 98.0 /100 | #96 | Exceptional 49.7% |
| Immigrants | Ukraine | 98.0 /100 | #97 | Exceptional 49.7% |
| Immigrants | Northern Africa | 97.9 /100 | #98 | Exceptional 49.7% |
| Macedonians | 97.8 /100 | #99 | Exceptional 49.6% |
| Immigrants | Nepal | 97.5 /100 | #100 | Exceptional 49.5% |
| Northern Europeans | 97.3 /100 | #101 | Exceptional 49.5% |
| Chileans | 97.3 /100 | #102 | Exceptional 49.4% |
| Ukrainians | 97.1 /100 | #103 | Exceptional 49.4% |
| Venezuelans | 97.0 /100 | #104 | Exceptional 49.4% |
| Croatians | 96.8 /100 | #105 | Exceptional 49.3% |
| Immigrants | Italy | 96.7 /100 | #106 | Exceptional 49.3% |
| Syrians | 96.7 /100 | #107 | Exceptional 49.3% |
| Jordanians | 96.6 /100 | #108 | Exceptional 49.2% |
| Immigrants | Morocco | 96.3 /100 | #109 | Exceptional 49.2% |
| Austrians | 95.8 /100 | #110 | Exceptional 49.1% |
| Immigrants | Venezuela | 95.8 /100 | #111 | Exceptional 49.1% |
| Immigrants | Chile | 95.3 /100 | #112 | Exceptional 49.0% |
| Palestinians | 95.3 /100 | #113 | Exceptional 49.0% |
| Arabs | 95.3 /100 | #114 | Exceptional 49.0% |
| Luxembourgers | 95.1 /100 | #115 | Exceptional 48.9% |
| British | 95.0 /100 | #116 | Exceptional 48.9% |