Immigrants from Nepal vs Immigrants from Greece College, Under 1 year
COMPARE
Immigrants from Nepal
Immigrants from Greece
College, Under 1 year
College, Under 1 year Comparison
Immigrants from Nepal
Immigrants from Greece
67.5%
COLLEGE, UNDER 1 YEAR
94.9/ 100
METRIC RATING
116th/ 347
METRIC RANK
68.4%
COLLEGE, UNDER 1 YEAR
98.5/ 100
METRIC RATING
81st/ 347
METRIC RANK
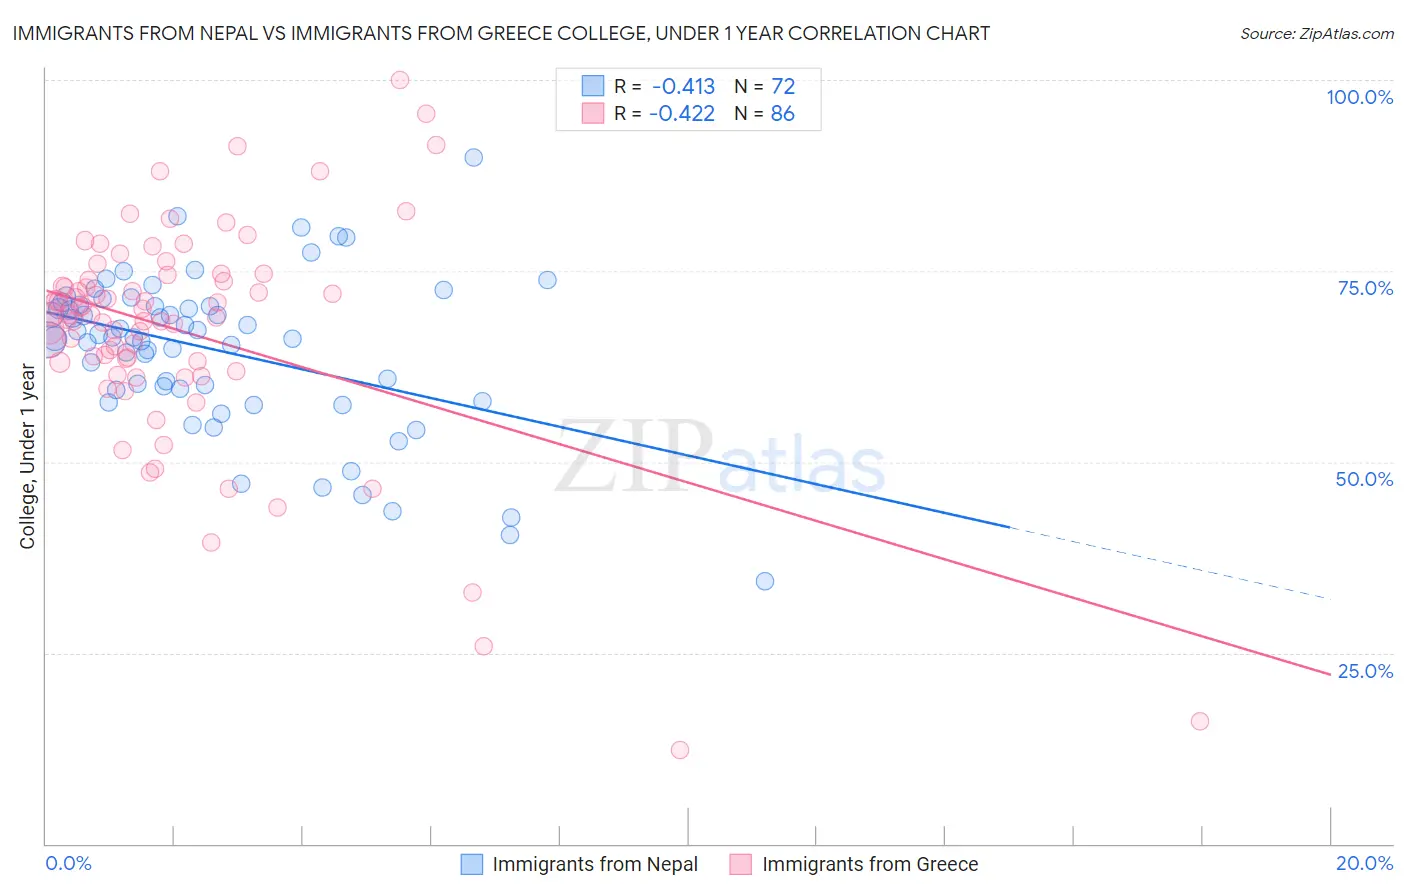
Immigrants from Nepal vs Immigrants from Greece College, Under 1 year Correlation Chart
The statistical analysis conducted on geographies consisting of 186,775,596 people shows a moderate negative correlation between the proportion of Immigrants from Nepal and percentage of population with at least college, under 1 year education in the United States with a correlation coefficient (R) of -0.413 and weighted average of 67.5%. Similarly, the statistical analysis conducted on geographies consisting of 216,879,519 people shows a moderate negative correlation between the proportion of Immigrants from Greece and percentage of population with at least college, under 1 year education in the United States with a correlation coefficient (R) of -0.422 and weighted average of 68.4%, a difference of 1.3%.
College, Under 1 year Correlation Summary
| Measurement | Immigrants from Nepal | Immigrants from Greece |
| Minimum | 34.4% | 12.4% |
| Maximum | 89.8% | 100.0% |
| Range | 55.5% | 87.6% |
| Mean | 64.6% | 67.1% |
| Median | 66.3% | 69.3% |
| Interquartile 25% (IQ1) | 59.5% | 63.1% |
| Interquartile 75% (IQ3) | 70.5% | 73.8% |
| Interquartile Range (IQR) | 11.0% | 10.7% |
| Standard Deviation (Sample) | 10.3% | 14.9% |
| Standard Deviation (Population) | 10.2% | 14.8% |
Similar Demographics by College, Under 1 year
Demographics Similar to Immigrants from Nepal by College, Under 1 year
In terms of college, under 1 year, the demographic groups most similar to Immigrants from Nepal are Pakistani (67.5%, a difference of 0.020%), Immigrants from Ukraine (67.5%, a difference of 0.040%), Lebanese (67.5%, a difference of 0.060%), Basque (67.6%, a difference of 0.080%), and Chilean (67.6%, a difference of 0.090%).
| Demographics | Rating | Rank | College, Under 1 year |
| Scandinavians | 95.8 /100 | #109 | Exceptional 67.7% |
| Assyrians/Chaldeans/Syriacs | 95.8 /100 | #110 | Exceptional 67.7% |
| Ukrainians | 95.8 /100 | #111 | Exceptional 67.7% |
| Macedonians | 95.7 /100 | #112 | Exceptional 67.6% |
| Syrians | 95.6 /100 | #113 | Exceptional 67.6% |
| Chileans | 95.3 /100 | #114 | Exceptional 67.6% |
| Basques | 95.2 /100 | #115 | Exceptional 67.6% |
| Immigrants | Nepal | 94.9 /100 | #116 | Exceptional 67.5% |
| Pakistanis | 94.8 /100 | #117 | Exceptional 67.5% |
| Immigrants | Ukraine | 94.7 /100 | #118 | Exceptional 67.5% |
| Lebanese | 94.6 /100 | #119 | Exceptional 67.5% |
| Serbians | 93.9 /100 | #120 | Exceptional 67.4% |
| Slovenes | 93.3 /100 | #121 | Exceptional 67.3% |
| Immigrants | Jordan | 92.8 /100 | #122 | Exceptional 67.3% |
| Immigrants | Northern Africa | 92.7 /100 | #123 | Exceptional 67.2% |
Demographics Similar to Immigrants from Greece by College, Under 1 year
In terms of college, under 1 year, the demographic groups most similar to Immigrants from Greece are Immigrants from Spain (68.4%, a difference of 0.040%), Norwegian (68.4%, a difference of 0.050%), Greek (68.5%, a difference of 0.070%), Argentinean (68.4%, a difference of 0.070%), and Danish (68.5%, a difference of 0.080%).
| Demographics | Rating | Rank | College, Under 1 year |
| Swedes | 98.9 /100 | #74 | Exceptional 68.7% |
| Immigrants | Western Europe | 98.6 /100 | #75 | Exceptional 68.5% |
| Laotians | 98.6 /100 | #76 | Exceptional 68.5% |
| British | 98.6 /100 | #77 | Exceptional 68.5% |
| Danes | 98.6 /100 | #78 | Exceptional 68.5% |
| Greeks | 98.6 /100 | #79 | Exceptional 68.5% |
| Immigrants | Spain | 98.5 /100 | #80 | Exceptional 68.4% |
| Immigrants | Greece | 98.5 /100 | #81 | Exceptional 68.4% |
| Norwegians | 98.4 /100 | #82 | Exceptional 68.4% |
| Argentineans | 98.4 /100 | #83 | Exceptional 68.4% |
| Immigrants | Hungary | 98.3 /100 | #84 | Exceptional 68.3% |
| Egyptians | 98.3 /100 | #85 | Exceptional 68.3% |
| Immigrants | Lebanon | 98.3 /100 | #86 | Exceptional 68.3% |
| Chinese | 98.3 /100 | #87 | Exceptional 68.3% |
| Croatians | 98.2 /100 | #88 | Exceptional 68.3% |