Uruguayan vs Immigrants from Greece College, Under 1 year
COMPARE
Uruguayan
Immigrants from Greece
College, Under 1 year
College, Under 1 year Comparison
Uruguayans
Immigrants from Greece
64.2%
COLLEGE, UNDER 1 YEAR
15.6/ 100
METRIC RATING
203rd/ 347
METRIC RANK
68.4%
COLLEGE, UNDER 1 YEAR
98.5/ 100
METRIC RATING
81st/ 347
METRIC RANK
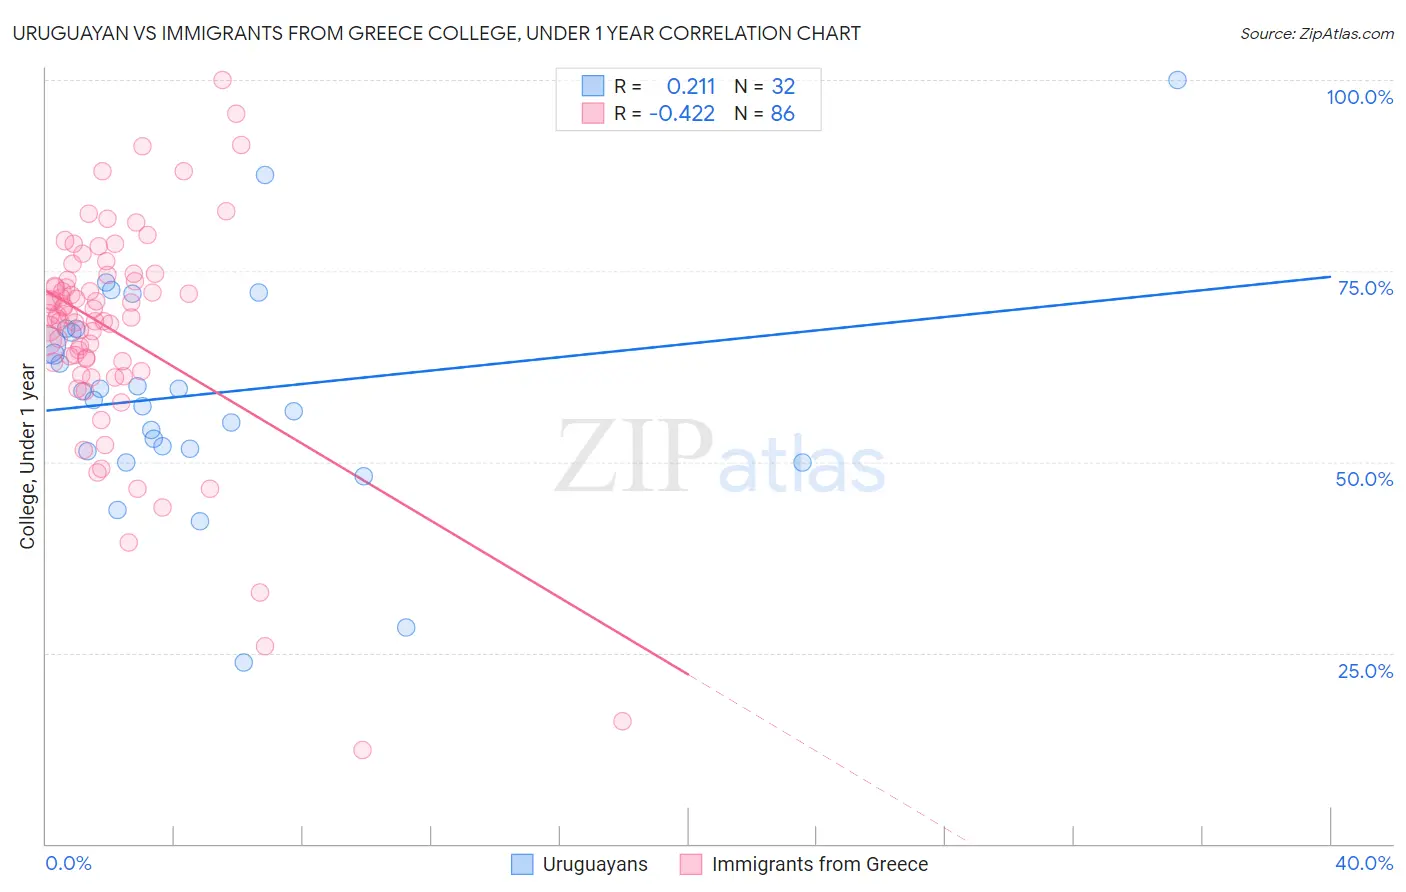
Uruguayan vs Immigrants from Greece College, Under 1 year Correlation Chart
The statistical analysis conducted on geographies consisting of 144,782,794 people shows a weak positive correlation between the proportion of Uruguayans and percentage of population with at least college, under 1 year education in the United States with a correlation coefficient (R) of 0.211 and weighted average of 64.2%. Similarly, the statistical analysis conducted on geographies consisting of 216,879,519 people shows a moderate negative correlation between the proportion of Immigrants from Greece and percentage of population with at least college, under 1 year education in the United States with a correlation coefficient (R) of -0.422 and weighted average of 68.4%, a difference of 6.6%.
College, Under 1 year Correlation Summary
| Measurement | Uruguayan | Immigrants from Greece |
| Minimum | 23.7% | 12.4% |
| Maximum | 100.0% | 100.0% |
| Range | 76.2% | 87.6% |
| Mean | 58.9% | 67.1% |
| Median | 58.7% | 69.3% |
| Interquartile 25% (IQ1) | 51.6% | 63.1% |
| Interquartile 75% (IQ3) | 67.2% | 73.8% |
| Interquartile Range (IQR) | 15.6% | 10.7% |
| Standard Deviation (Sample) | 14.8% | 14.9% |
| Standard Deviation (Population) | 14.5% | 14.8% |
Similar Demographics by College, Under 1 year
Demographics Similar to Uruguayans by College, Under 1 year
In terms of college, under 1 year, the demographic groups most similar to Uruguayans are French Canadian (64.2%, a difference of 0.050%), South American (64.2%, a difference of 0.050%), Nigerian (64.3%, a difference of 0.090%), Immigrants from Zaire (64.1%, a difference of 0.090%), and Panamanian (64.3%, a difference of 0.11%).
| Demographics | Rating | Rank | College, Under 1 year |
| Tongans | 21.2 /100 | #196 | Fair 64.5% |
| Costa Ricans | 19.6 /100 | #197 | Poor 64.4% |
| Tsimshian | 17.9 /100 | #198 | Poor 64.3% |
| Panamanians | 17.0 /100 | #199 | Poor 64.3% |
| Nigerians | 16.7 /100 | #200 | Poor 64.3% |
| French Canadians | 16.3 /100 | #201 | Poor 64.2% |
| South Americans | 16.2 /100 | #202 | Poor 64.2% |
| Uruguayans | 15.6 /100 | #203 | Poor 64.2% |
| Immigrants | Zaire | 14.6 /100 | #204 | Poor 64.1% |
| Peruvians | 13.7 /100 | #205 | Poor 64.1% |
| Whites/Caucasians | 12.8 /100 | #206 | Poor 64.0% |
| Colombians | 12.4 /100 | #207 | Poor 64.0% |
| Immigrants | Vietnam | 12.1 /100 | #208 | Poor 64.0% |
| Puget Sound Salish | 11.3 /100 | #209 | Poor 63.9% |
| Ghanaians | 11.2 /100 | #210 | Poor 63.9% |
Demographics Similar to Immigrants from Greece by College, Under 1 year
In terms of college, under 1 year, the demographic groups most similar to Immigrants from Greece are Immigrants from Spain (68.4%, a difference of 0.040%), Norwegian (68.4%, a difference of 0.050%), Greek (68.5%, a difference of 0.070%), Argentinean (68.4%, a difference of 0.070%), and Danish (68.5%, a difference of 0.080%).
| Demographics | Rating | Rank | College, Under 1 year |
| Swedes | 98.9 /100 | #74 | Exceptional 68.7% |
| Immigrants | Western Europe | 98.6 /100 | #75 | Exceptional 68.5% |
| Laotians | 98.6 /100 | #76 | Exceptional 68.5% |
| British | 98.6 /100 | #77 | Exceptional 68.5% |
| Danes | 98.6 /100 | #78 | Exceptional 68.5% |
| Greeks | 98.6 /100 | #79 | Exceptional 68.5% |
| Immigrants | Spain | 98.5 /100 | #80 | Exceptional 68.4% |
| Immigrants | Greece | 98.5 /100 | #81 | Exceptional 68.4% |
| Norwegians | 98.4 /100 | #82 | Exceptional 68.4% |
| Argentineans | 98.4 /100 | #83 | Exceptional 68.4% |
| Immigrants | Hungary | 98.3 /100 | #84 | Exceptional 68.3% |
| Egyptians | 98.3 /100 | #85 | Exceptional 68.3% |
| Immigrants | Lebanon | 98.3 /100 | #86 | Exceptional 68.3% |
| Chinese | 98.3 /100 | #87 | Exceptional 68.3% |
| Croatians | 98.2 /100 | #88 | Exceptional 68.3% |