Immigrants from Nepal vs Portuguese College, Under 1 year
COMPARE
Immigrants from Nepal
Portuguese
College, Under 1 year
College, Under 1 year Comparison
Immigrants from Nepal
Portuguese
67.5%
COLLEGE, UNDER 1 YEAR
94.9/ 100
METRIC RATING
116th/ 347
METRIC RANK
63.4%
COLLEGE, UNDER 1 YEAR
5.6/ 100
METRIC RATING
220th/ 347
METRIC RANK
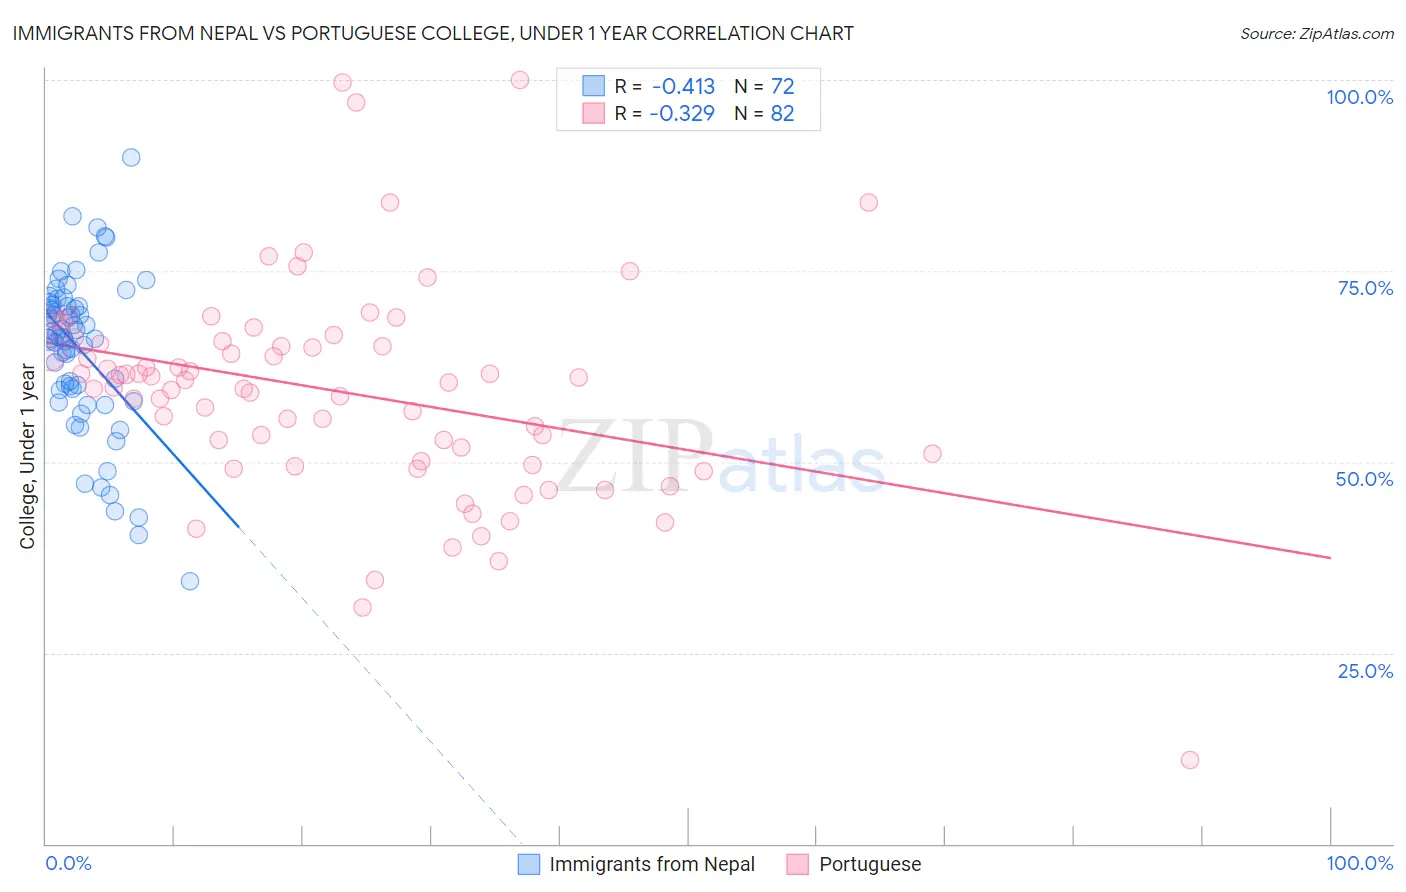
Immigrants from Nepal vs Portuguese College, Under 1 year Correlation Chart
The statistical analysis conducted on geographies consisting of 186,775,596 people shows a moderate negative correlation between the proportion of Immigrants from Nepal and percentage of population with at least college, under 1 year education in the United States with a correlation coefficient (R) of -0.413 and weighted average of 67.5%. Similarly, the statistical analysis conducted on geographies consisting of 450,365,822 people shows a mild negative correlation between the proportion of Portuguese and percentage of population with at least college, under 1 year education in the United States with a correlation coefficient (R) of -0.329 and weighted average of 63.4%, a difference of 6.5%.
College, Under 1 year Correlation Summary
| Measurement | Immigrants from Nepal | Portuguese |
| Minimum | 34.4% | 11.0% |
| Maximum | 89.8% | 100.0% |
| Range | 55.5% | 89.0% |
| Mean | 64.6% | 59.1% |
| Median | 66.3% | 60.1% |
| Interquartile 25% (IQ1) | 59.5% | 50.1% |
| Interquartile 75% (IQ3) | 70.5% | 65.5% |
| Interquartile Range (IQR) | 11.0% | 15.4% |
| Standard Deviation (Sample) | 10.3% | 14.2% |
| Standard Deviation (Population) | 10.2% | 14.1% |
Similar Demographics by College, Under 1 year
Demographics Similar to Immigrants from Nepal by College, Under 1 year
In terms of college, under 1 year, the demographic groups most similar to Immigrants from Nepal are Pakistani (67.5%, a difference of 0.020%), Immigrants from Ukraine (67.5%, a difference of 0.040%), Lebanese (67.5%, a difference of 0.060%), Basque (67.6%, a difference of 0.080%), and Chilean (67.6%, a difference of 0.090%).
| Demographics | Rating | Rank | College, Under 1 year |
| Scandinavians | 95.8 /100 | #109 | Exceptional 67.7% |
| Assyrians/Chaldeans/Syriacs | 95.8 /100 | #110 | Exceptional 67.7% |
| Ukrainians | 95.8 /100 | #111 | Exceptional 67.7% |
| Macedonians | 95.7 /100 | #112 | Exceptional 67.6% |
| Syrians | 95.6 /100 | #113 | Exceptional 67.6% |
| Chileans | 95.3 /100 | #114 | Exceptional 67.6% |
| Basques | 95.2 /100 | #115 | Exceptional 67.6% |
| Immigrants | Nepal | 94.9 /100 | #116 | Exceptional 67.5% |
| Pakistanis | 94.8 /100 | #117 | Exceptional 67.5% |
| Immigrants | Ukraine | 94.7 /100 | #118 | Exceptional 67.5% |
| Lebanese | 94.6 /100 | #119 | Exceptional 67.5% |
| Serbians | 93.9 /100 | #120 | Exceptional 67.4% |
| Slovenes | 93.3 /100 | #121 | Exceptional 67.3% |
| Immigrants | Jordan | 92.8 /100 | #122 | Exceptional 67.3% |
| Immigrants | Northern Africa | 92.7 /100 | #123 | Exceptional 67.2% |
Demographics Similar to Portuguese by College, Under 1 year
In terms of college, under 1 year, the demographic groups most similar to Portuguese are Immigrants from Fiji (63.4%, a difference of 0.020%), Immigrants from Panama (63.4%, a difference of 0.030%), Immigrants from Uruguay (63.4%, a difference of 0.050%), Cree (63.3%, a difference of 0.090%), and Immigrants from Senegal (63.3%, a difference of 0.14%).
| Demographics | Rating | Rank | College, Under 1 year |
| Immigrants | South America | 9.1 /100 | #213 | Tragic 63.8% |
| Immigrants | Nigeria | 8.8 /100 | #214 | Tragic 63.7% |
| Senegalese | 7.7 /100 | #215 | Tragic 63.6% |
| Hmong | 6.8 /100 | #216 | Tragic 63.5% |
| Immigrants | Uruguay | 5.8 /100 | #217 | Tragic 63.4% |
| Immigrants | Panama | 5.7 /100 | #218 | Tragic 63.4% |
| Immigrants | Fiji | 5.7 /100 | #219 | Tragic 63.4% |
| Portuguese | 5.6 /100 | #220 | Tragic 63.4% |
| Cree | 5.2 /100 | #221 | Tragic 63.3% |
| Immigrants | Senegal | 5.0 /100 | #222 | Tragic 63.3% |
| Immigrants | Costa Rica | 4.5 /100 | #223 | Tragic 63.2% |
| Sub-Saharan Africans | 4.4 /100 | #224 | Tragic 63.2% |
| Immigrants | Peru | 4.0 /100 | #225 | Tragic 63.1% |
| Immigrants | Colombia | 4.0 /100 | #226 | Tragic 63.1% |
| Immigrants | Ghana | 3.7 /100 | #227 | Tragic 63.1% |