Immigrants from Morocco vs Immigrants from Eastern Asia Associate's Degree
COMPARE
Immigrants from Morocco
Immigrants from Eastern Asia
Associate's Degree
Associate's Degree Comparison
Immigrants from Morocco
Immigrants from Eastern Asia
49.2%
ASSOCIATE'S DEGREE
96.3/ 100
METRIC RATING
109th/ 347
METRIC RANK
55.4%
ASSOCIATE'S DEGREE
100.0/ 100
METRIC RATING
15th/ 347
METRIC RANK
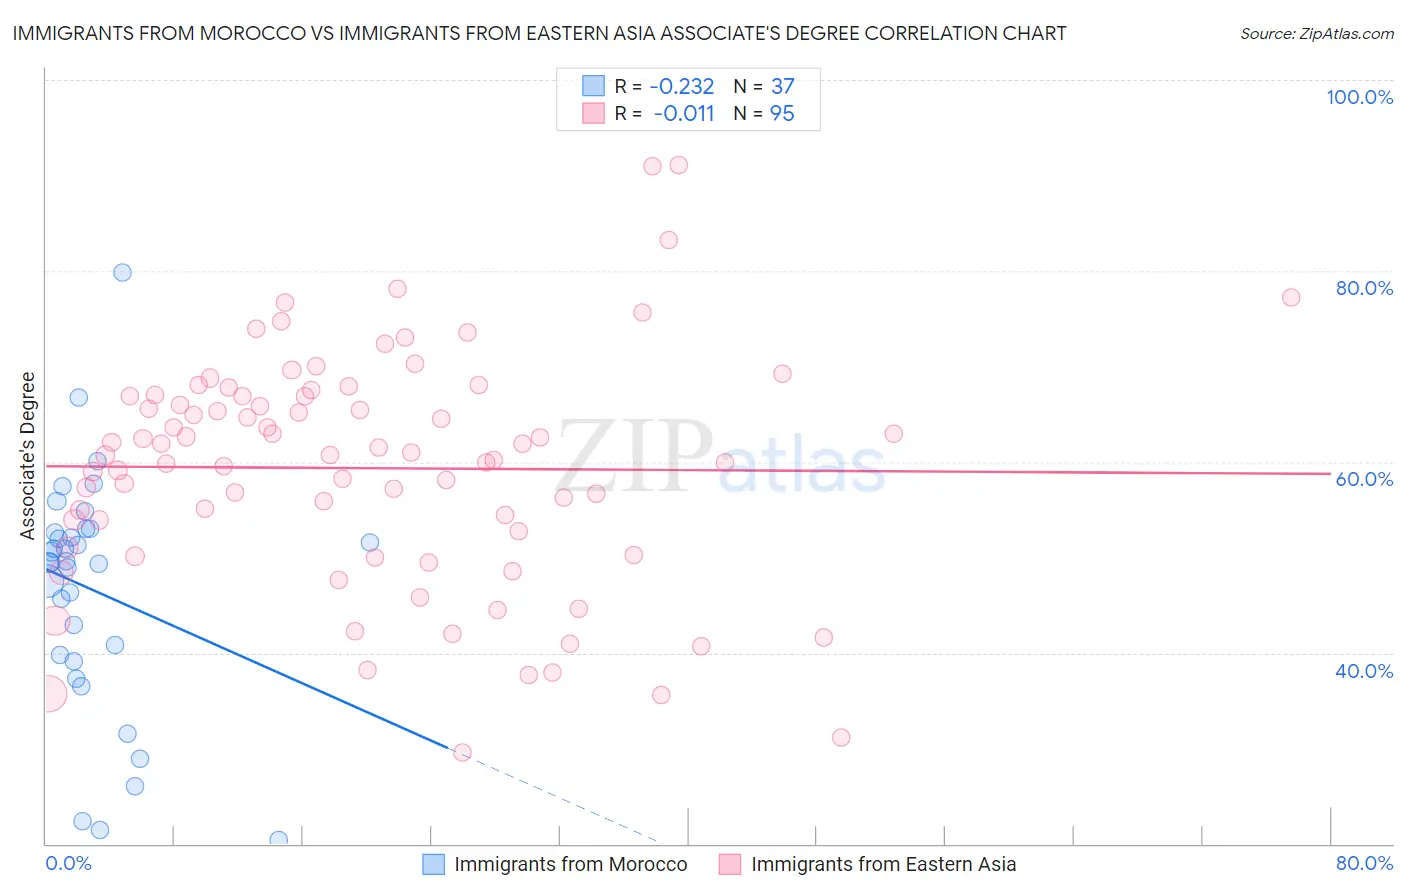
Immigrants from Morocco vs Immigrants from Eastern Asia Associate's Degree Correlation Chart
The statistical analysis conducted on geographies consisting of 178,912,438 people shows a weak negative correlation between the proportion of Immigrants from Morocco and percentage of population with at least associate's degree education in the United States with a correlation coefficient (R) of -0.232 and weighted average of 49.2%. Similarly, the statistical analysis conducted on geographies consisting of 499,873,400 people shows no correlation between the proportion of Immigrants from Eastern Asia and percentage of population with at least associate's degree education in the United States with a correlation coefficient (R) of -0.011 and weighted average of 55.4%, a difference of 12.6%.
Associate's Degree Correlation Summary
| Measurement | Immigrants from Morocco | Immigrants from Eastern Asia |
| Minimum | 20.4% | 29.6% |
| Maximum | 79.9% | 91.1% |
| Range | 59.4% | 61.5% |
| Mean | 46.6% | 59.3% |
| Median | 49.4% | 60.8% |
| Interquartile 25% (IQ1) | 39.4% | 51.1% |
| Interquartile 75% (IQ3) | 52.8% | 66.9% |
| Interquartile Range (IQR) | 13.4% | 15.8% |
| Standard Deviation (Sample) | 12.5% | 12.2% |
| Standard Deviation (Population) | 12.3% | 12.2% |
Similar Demographics by Associate's Degree
Demographics Similar to Immigrants from Morocco by Associate's Degree
In terms of associate's degree, the demographic groups most similar to Immigrants from Morocco are Jordanian (49.2%, a difference of 0.13%), Syrian (49.3%, a difference of 0.20%), Austrian (49.1%, a difference of 0.22%), Croatian (49.3%, a difference of 0.23%), and Immigrants from Italy (49.3%, a difference of 0.23%).
| Demographics | Rating | Rank | Associate's Degree |
| Chileans | 97.3 /100 | #102 | Exceptional 49.4% |
| Ukrainians | 97.1 /100 | #103 | Exceptional 49.4% |
| Venezuelans | 97.0 /100 | #104 | Exceptional 49.4% |
| Croatians | 96.8 /100 | #105 | Exceptional 49.3% |
| Immigrants | Italy | 96.7 /100 | #106 | Exceptional 49.3% |
| Syrians | 96.7 /100 | #107 | Exceptional 49.3% |
| Jordanians | 96.6 /100 | #108 | Exceptional 49.2% |
| Immigrants | Morocco | 96.3 /100 | #109 | Exceptional 49.2% |
| Austrians | 95.8 /100 | #110 | Exceptional 49.1% |
| Immigrants | Venezuela | 95.8 /100 | #111 | Exceptional 49.1% |
| Immigrants | Chile | 95.3 /100 | #112 | Exceptional 49.0% |
| Palestinians | 95.3 /100 | #113 | Exceptional 49.0% |
| Arabs | 95.3 /100 | #114 | Exceptional 49.0% |
| Luxembourgers | 95.1 /100 | #115 | Exceptional 48.9% |
| British | 95.0 /100 | #116 | Exceptional 48.9% |
Demographics Similar to Immigrants from Eastern Asia by Associate's Degree
In terms of associate's degree, the demographic groups most similar to Immigrants from Eastern Asia are Immigrants from Hong Kong (55.4%, a difference of 0.030%), Immigrants from China (55.5%, a difference of 0.17%), Soviet Union (55.1%, a difference of 0.47%), Eastern European (55.0%, a difference of 0.61%), and Immigrants from South Central Asia (55.7%, a difference of 0.67%).
| Demographics | Rating | Rank | Associate's Degree |
| Thais | 100.0 /100 | #8 | Exceptional 57.4% |
| Immigrants | Israel | 100.0 /100 | #9 | Exceptional 56.8% |
| Cypriots | 100.0 /100 | #10 | Exceptional 56.4% |
| Immigrants | Australia | 100.0 /100 | #11 | Exceptional 55.8% |
| Immigrants | South Central Asia | 100.0 /100 | #12 | Exceptional 55.7% |
| Immigrants | China | 100.0 /100 | #13 | Exceptional 55.5% |
| Immigrants | Hong Kong | 100.0 /100 | #14 | Exceptional 55.4% |
| Immigrants | Eastern Asia | 100.0 /100 | #15 | Exceptional 55.4% |
| Soviet Union | 100.0 /100 | #16 | Exceptional 55.1% |
| Eastern Europeans | 100.0 /100 | #17 | Exceptional 55.0% |
| Indians (Asian) | 100.0 /100 | #18 | Exceptional 54.8% |
| Immigrants | Ireland | 100.0 /100 | #19 | Exceptional 54.7% |
| Cambodians | 100.0 /100 | #20 | Exceptional 54.6% |
| Immigrants | Sweden | 100.0 /100 | #21 | Exceptional 54.6% |
| Immigrants | Japan | 100.0 /100 | #22 | Exceptional 54.6% |