Immigrants from Morocco vs Immigrants from Poland Nursery School
COMPARE
Immigrants from Morocco
Immigrants from Poland
Nursery School
Nursery School Comparison
Immigrants from Morocco
Immigrants from Poland
97.8%
NURSERY SCHOOL
5.1/ 100
METRIC RATING
219th/ 347
METRIC RANK
98.0%
NURSERY SCHOOL
41.3/ 100
METRIC RATING
184th/ 347
METRIC RANK
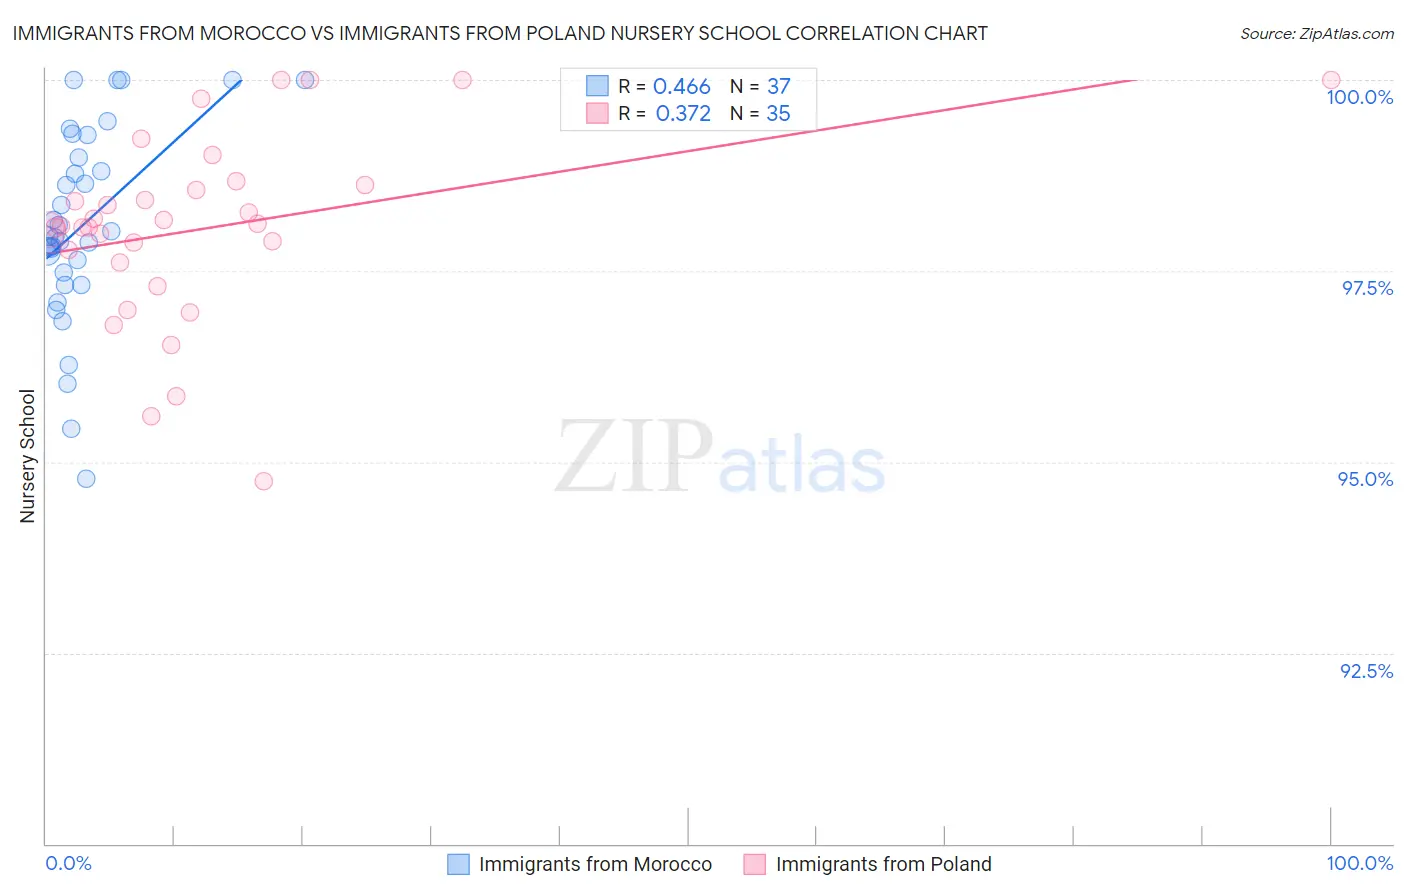
Immigrants from Morocco vs Immigrants from Poland Nursery School Correlation Chart
The statistical analysis conducted on geographies consisting of 178,912,438 people shows a moderate positive correlation between the proportion of Immigrants from Morocco and percentage of population with at least nursery school education in the United States with a correlation coefficient (R) of 0.466 and weighted average of 97.8%. Similarly, the statistical analysis conducted on geographies consisting of 304,861,559 people shows a mild positive correlation between the proportion of Immigrants from Poland and percentage of population with at least nursery school education in the United States with a correlation coefficient (R) of 0.372 and weighted average of 98.0%, a difference of 0.19%.
Nursery School Correlation Summary
| Measurement | Immigrants from Morocco | Immigrants from Poland |
| Minimum | 94.8% | 94.8% |
| Maximum | 100.0% | 100.0% |
| Range | 5.2% | 5.2% |
| Mean | 98.1% | 98.1% |
| Median | 98.0% | 98.1% |
| Interquartile 25% (IQ1) | 97.4% | 97.6% |
| Interquartile 75% (IQ3) | 99.1% | 98.6% |
| Interquartile Range (IQR) | 1.7% | 1.0% |
| Standard Deviation (Sample) | 1.3% | 1.2% |
| Standard Deviation (Population) | 1.3% | 1.2% |
Similar Demographics by Nursery School
Demographics Similar to Immigrants from Morocco by Nursery School
In terms of nursery school, the demographic groups most similar to Immigrants from Morocco are Immigrants from Panama (97.8%, a difference of 0.0%), Immigrants from Zaire (97.8%, a difference of 0.010%), Tongan (97.8%, a difference of 0.010%), Samoan (97.8%, a difference of 0.020%), and Immigrants from Syria (97.7%, a difference of 0.020%).
| Demographics | Rating | Rank | Nursery School |
| Immigrants | Bahamas | 8.6 /100 | #212 | Tragic 97.8% |
| Moroccans | 8.3 /100 | #213 | Tragic 97.8% |
| South American Indians | 8.0 /100 | #214 | Tragic 97.8% |
| Bahamians | 7.4 /100 | #215 | Tragic 97.8% |
| Uruguayans | 7.1 /100 | #216 | Tragic 97.8% |
| Samoans | 6.3 /100 | #217 | Tragic 97.8% |
| Immigrants | Panama | 5.3 /100 | #218 | Tragic 97.8% |
| Immigrants | Morocco | 5.1 /100 | #219 | Tragic 97.8% |
| Immigrants | Zaire | 4.4 /100 | #220 | Tragic 97.8% |
| Tongans | 4.3 /100 | #221 | Tragic 97.8% |
| Immigrants | Syria | 4.0 /100 | #222 | Tragic 97.7% |
| Immigrants | Sudan | 3.9 /100 | #223 | Tragic 97.7% |
| Immigrants | Nepal | 3.6 /100 | #224 | Tragic 97.7% |
| Immigrants | Costa Rica | 3.5 /100 | #225 | Tragic 97.7% |
| Iraqis | 3.5 /100 | #226 | Tragic 97.7% |
Demographics Similar to Immigrants from Poland by Nursery School
In terms of nursery school, the demographic groups most similar to Immigrants from Poland are Egyptian (98.0%, a difference of 0.0%), Paiute (98.0%, a difference of 0.0%), Portuguese (98.0%, a difference of 0.0%), Immigrants from Belarus (98.0%, a difference of 0.0%), and Immigrants from Argentina (98.0%, a difference of 0.0%).
| Demographics | Rating | Rank | Nursery School |
| Albanians | 48.9 /100 | #177 | Average 98.0% |
| Natives/Alaskans | 48.6 /100 | #178 | Average 98.0% |
| Argentineans | 46.8 /100 | #179 | Average 98.0% |
| Immigrants | Bosnia and Herzegovina | 45.6 /100 | #180 | Average 98.0% |
| Egyptians | 42.8 /100 | #181 | Average 98.0% |
| Paiute | 42.0 /100 | #182 | Average 98.0% |
| Portuguese | 41.8 /100 | #183 | Average 98.0% |
| Immigrants | Poland | 41.3 /100 | #184 | Average 98.0% |
| Immigrants | Belarus | 41.0 /100 | #185 | Average 98.0% |
| Immigrants | Argentina | 40.8 /100 | #186 | Average 98.0% |
| Immigrants | Kazakhstan | 37.1 /100 | #187 | Fair 97.9% |
| Arabs | 34.7 /100 | #188 | Fair 97.9% |
| Pakistanis | 34.6 /100 | #189 | Fair 97.9% |
| Panamanians | 34.3 /100 | #190 | Fair 97.9% |
| Immigrants | Taiwan | 30.6 /100 | #191 | Fair 97.9% |