Immigrants from Moldova vs Czech Doctorate Degree
COMPARE
Immigrants from Moldova
Czech
Doctorate Degree
Doctorate Degree Comparison
Immigrants from Moldova
Czechs
2.0%
DOCTORATE DEGREE
84.3/ 100
METRIC RATING
144th/ 347
METRIC RANK
1.9%
DOCTORATE DEGREE
67.3/ 100
METRIC RATING
163rd/ 347
METRIC RANK
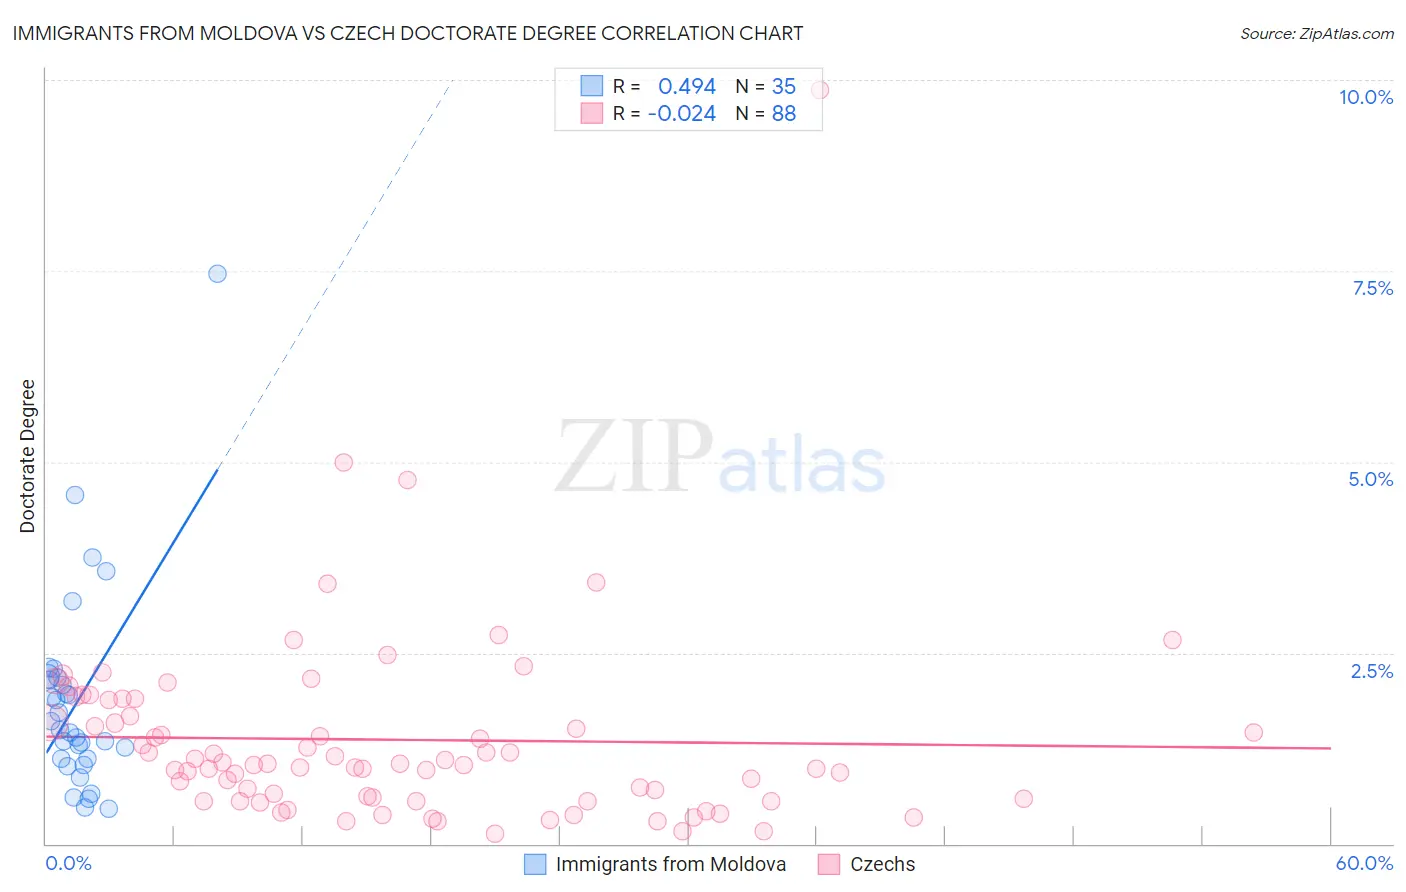
Immigrants from Moldova vs Czech Doctorate Degree Correlation Chart
The statistical analysis conducted on geographies consisting of 124,175,458 people shows a moderate positive correlation between the proportion of Immigrants from Moldova and percentage of population with at least doctorate degree education in the United States with a correlation coefficient (R) of 0.494 and weighted average of 2.0%. Similarly, the statistical analysis conducted on geographies consisting of 474,197,515 people shows no correlation between the proportion of Czechs and percentage of population with at least doctorate degree education in the United States with a correlation coefficient (R) of -0.024 and weighted average of 1.9%, a difference of 3.4%.
Doctorate Degree Correlation Summary
| Measurement | Immigrants from Moldova | Czech |
| Minimum | 0.45% | 0.13% |
| Maximum | 7.5% | 9.9% |
| Range | 7.0% | 9.7% |
| Mean | 1.9% | 1.4% |
| Median | 1.5% | 1.0% |
| Interquartile 25% (IQ1) | 1.1% | 0.58% |
| Interquartile 75% (IQ3) | 2.2% | 1.8% |
| Interquartile Range (IQR) | 1.1% | 1.2% |
| Standard Deviation (Sample) | 1.3% | 1.3% |
| Standard Deviation (Population) | 1.3% | 1.3% |
Demographics Similar to Immigrants from Moldova and Czechs by Doctorate Degree
In terms of doctorate degree, the demographic groups most similar to Immigrants from Moldova are Kenyan (1.9%, a difference of 0.18%), Immigrants from Syria (1.9%, a difference of 0.20%), Sierra Leonean (2.0%, a difference of 0.21%), Immigrants from Senegal (1.9%, a difference of 0.45%), and Luxembourger (1.9%, a difference of 0.78%). Similarly, the demographic groups most similar to Czechs are Irish (1.9%, a difference of 0.040%), Immigrants from Middle Africa (1.9%, a difference of 0.25%), Welsh (1.9%, a difference of 0.40%), Slovene (1.9%, a difference of 0.49%), and Hungarian (1.9%, a difference of 0.75%).
| Demographics | Rating | Rank | Doctorate Degree |
| Sierra Leoneans | 85.1 /100 | #143 | Excellent 2.0% |
| Immigrants | Moldova | 84.3 /100 | #144 | Excellent 2.0% |
| Kenyans | 83.6 /100 | #145 | Excellent 1.9% |
| Immigrants | Syria | 83.6 /100 | #146 | Excellent 1.9% |
| Immigrants | Senegal | 82.5 /100 | #147 | Excellent 1.9% |
| Luxembourgers | 81.1 /100 | #148 | Excellent 1.9% |
| Basques | 76.9 /100 | #149 | Good 1.9% |
| English | 75.9 /100 | #150 | Good 1.9% |
| Albanians | 74.8 /100 | #151 | Good 1.9% |
| Immigrants | Kenya | 74.3 /100 | #152 | Good 1.9% |
| Immigrants | Oceania | 74.0 /100 | #153 | Good 1.9% |
| Immigrants | Albania | 72.8 /100 | #154 | Good 1.9% |
| Poles | 72.7 /100 | #155 | Good 1.9% |
| Slavs | 72.4 /100 | #156 | Good 1.9% |
| Danes | 71.9 /100 | #157 | Good 1.9% |
| Hungarians | 71.7 /100 | #158 | Good 1.9% |
| Slovenes | 70.2 /100 | #159 | Good 1.9% |
| Welsh | 69.7 /100 | #160 | Good 1.9% |
| Immigrants | Middle Africa | 68.8 /100 | #161 | Good 1.9% |
| Irish | 67.5 /100 | #162 | Good 1.9% |
| Czechs | 67.3 /100 | #163 | Good 1.9% |